Ccil10 940409 full analysis,charts,indicators,moving averages,SMA,DMA,EMA,ADX,MACD,RSICcil 10 940409 WideScreen charts, DMA,SMA,EMA technical analysis, forecast prediction, by indicators ADX,MACD,RSI,CCI BSE stock exchange
Daily price and charts and targets Ccil10 Strong Daily Stock price targets for Ccil10 940409 are 989 and 989 | Daily Target 1 | 989 | | Daily Target 2 | 989 | | Daily Target 3 | 989 | | Daily Target 4 | 989 | | Daily Target 5 | 989 |
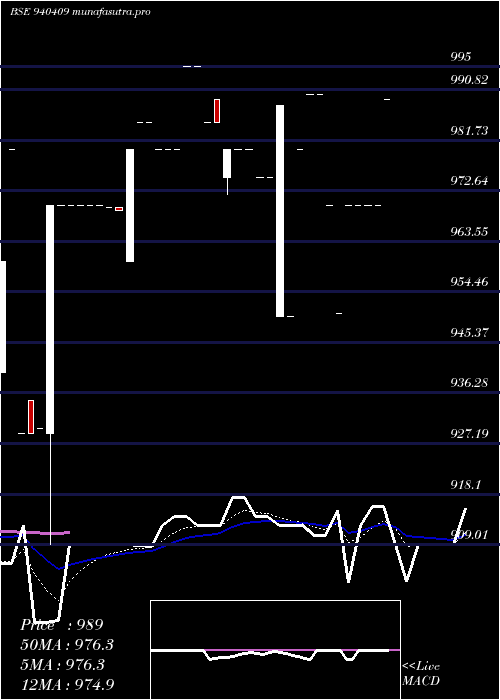
Daily price and volume Ccil 10
| Date |
Closing |
Open |
Range |
Volume |
Fri 05 December 2025 |
989.00 (1.95%) |
989.00 |
989.00 - 989.00 |
0.0134 times |
Thu 04 December 2025 |
970.11 (0%) |
970.11 |
970.11 - 970.11 |
0.0267 times |
Tue 02 December 2025 |
970.11 (0.01%) |
970.11 |
970.11 - 970.11 |
6.6979 times |
Fri 28 November 2025 |
970.00 (0%) |
970.00 |
970.00 - 970.00 |
0.0267 times |
Thu 27 November 2025 |
970.00 (2.04%) |
970.00 |
970.00 - 970.00 |
0.6684 times |
Tue 18 November 2025 |
950.60 (-2%) |
950.60 |
950.60 - 950.60 |
0.1337 times |
Thu 13 November 2025 |
970.00 (-2.02%) |
970.00 |
970.00 - 970.00 |
0.2674 times |
Wed 12 November 2025 |
989.99 (0%) |
989.99 |
989.99 - 989.99 |
0.0134 times |
Mon 10 November 2025 |
989.99 (1.01%) |
989.95 |
989.95 - 990.00 |
1.8048 times |
Fri 07 November 2025 |
980.11 (3.17%) |
980.00 |
980.00 - 980.11 |
0.3476 times |
Thu 06 November 2025 |
950.00 (-3.85%) |
950.00 |
950.00 - 950.00 |
0.1337 times |
Weekly price and charts Ccil10 Strong weekly Stock price targets for Ccil10 940409 are 979.56 and 998.45 | Weekly Target 1 | 963.81 | | Weekly Target 2 | 976.41 | | Weekly Target 3 | 982.70333333333 | | Weekly Target 4 | 995.3 | | Weekly Target 5 | 1001.59 |
Weekly price and volumes for Ccil 10
| Date |
Closing |
Open |
Range |
Volume |
Fri 05 December 2025 |
989.00 (1.96%) |
970.11 |
970.11 - 989.00 |
1.7172 times |
Fri 28 November 2025 |
970.00 (0%) |
950.60 |
950.60 - 970.00 |
0.2112 times |
Thu 13 November 2025 |
970.00 (-1.03%) |
989.95 |
970.00 - 990.00 |
0.5315 times |
Fri 07 November 2025 |
980.11 (0.51%) |
975.10 |
950.00 - 988.00 |
3.2641 times |
Thu 30 October 2025 |
975.10 (-0.5%) |
980.00 |
975.00 - 980.00 |
2.4225 times |
Thu 23 October 2025 |
980.00 (-0.51%) |
975.00 |
972.01 - 980.00 |
1.0562 times |
Fri 17 October 2025 |
985.00 (-1.01%) |
985.00 |
985.00 - 989.00 |
0.2215 times |
Wed 08 October 2025 |
995.00 (0%) |
995.00 |
995.00 - 995.00 |
0.0511 times |
Wed 24 September 2025 |
995.00 (1.53%) |
995.00 |
995.00 - 995.00 |
0.3407 times |
Fri 19 September 2025 |
980.00 (-0.51%) |
980.00 |
980.00 - 980.00 |
0.184 times |
Fri 12 September 2025 |
985.00 (1.55%) |
969.60 |
960.00 - 985.00 |
0.8927 times |

Monthly price and charts Ccil10 Strong monthly Stock price targets for Ccil10 940409 are 979.56 and 998.45 | Monthly Target 1 | 963.81 | | Monthly Target 2 | 976.41 | | Monthly Target 3 | 982.70333333333 | | Monthly Target 4 | 995.3 | | Monthly Target 5 | 1001.59 |
Monthly price and volumes Ccil 10
| Date |
Closing |
Open |
Range |
Volume |
Fri 05 December 2025 |
989.00 (1.96%) |
970.11 |
970.11 - 989.00 |
0.1473 times |
Fri 28 November 2025 |
970.00 (-0.52%) |
975.10 |
950.00 - 990.00 |
0.3438 times |
Thu 30 October 2025 |
975.10 (-2%) |
995.00 |
972.01 - 995.00 |
0.3218 times |
Wed 24 September 2025 |
995.00 (2.58%) |
970.00 |
960.00 - 995.00 |
0.1272 times |
Wed 20 August 2025 |
970.00 (4.41%) |
930.00 |
909.01 - 970.00 |
0.1231 times |
Thu 31 July 2025 |
929.01 (-7%) |
1000.00 |
929.01 - 1000.00 |
4.5612 times |
Mon 30 June 2025 |
998.90 (0%) |
1000.00 |
951.15 - 1000.00 |
1.3756 times |
Sun 07 December 2025 |
(0%) |
|
- |
0 times |

DMA SMA EMA moving averages of Ccil 10 940409
DMA (daily moving average) of Ccil 10 940409
| DMA period | DMA value | | 5 day DMA | 973.84 | | 12 day DMA | 973.99 | | 20 day DMA | 977.16 | | 35 day DMA | 976.76 | | 50 day DMA | 975.13 | | 100 day DMA | | | 150 day DMA | | | 200 day DMA | | EMA (exponential moving average) of Ccil 10 940409
| EMA period | EMA current | EMA prev | EMA prev2 | | 5 day EMA | 976.28 | 969.92 | 969.82 | | 12 day EMA | 974.93 | 972.37 | 972.78 | | 20 day EMA | 975.66 | 974.26 | 974.7 | | 35 day EMA | 975.97 | 975.2 | 975.5 | | 50 day EMA | 976.29 | 975.77 | 976 |
SMA (simple moving average) of Ccil 10 940409
| SMA period | SMA current | SMA prev | SMA prev2 | | 5 day SMA | 973.84 | 966.16 | 966.14 | | 12 day SMA | 973.99 | 972.83 | 973.25 | | 20 day SMA | 977.16 | 977.46 | 977.95 | | 35 day SMA | 976.76 | 975.08 | 973.9 | | 50 day SMA | 975.13 | 975.35 | 975.93 | | 100 day SMA | | 150 day SMA | | 200 day SMA |
|
|
