Efsl10 940103 full analysis,charts,indicators,moving averages,SMA,DMA,EMA,ADX,MACD,RSIEfsl 10 940103 WideScreen charts, DMA,SMA,EMA technical analysis, forecast prediction, by indicators ADX,MACD,RSI,CCI BSE stock exchange
Daily price and charts and targets Efsl10 Strong Daily Stock price targets for Efsl10 940103 are 1066.8 and 1066.8 | Daily Target 1 | 1066.8 | | Daily Target 2 | 1066.8 | | Daily Target 3 | 1066.8 | | Daily Target 4 | 1066.8 | | Daily Target 5 | 1066.8 |
Daily price and volume Efsl 10
| Date |
Closing |
Open |
Range |
Volume |
Fri 05 December 2025 |
1066.80 (1.38%) |
1066.80 |
1066.80 - 1066.80 |
1.0009 times |
Tue 02 December 2025 |
1052.23 (-0.92%) |
1052.50 |
1050.00 - 1061.90 |
4.4364 times |
Thu 27 November 2025 |
1062.00 (0%) |
1062.00 |
1062.00 - 1062.00 |
1.1542 times |
Tue 25 November 2025 |
1062.00 (0.76%) |
1054.00 |
1054.00 - 1062.00 |
0.8717 times |
Fri 14 November 2025 |
1054.00 (0.43%) |
1054.00 |
1054.00 - 1054.00 |
0.1653 times |
Thu 13 November 2025 |
1049.50 (1.22%) |
1049.50 |
1049.50 - 1049.50 |
0.9017 times |
Thu 23 October 2025 |
1036.80 (1.45%) |
1036.80 |
1036.80 - 1036.80 |
0.4448 times |
Tue 21 October 2025 |
1021.99 (0.97%) |
1020.20 |
1012.20 - 1036.80 |
0.7063 times |
Fri 19 September 2025 |
1012.20 (-2.2%) |
1012.20 |
1012.20 - 1012.20 |
0.009 times |
Mon 15 September 2025 |
1035.00 (0.7%) |
1035.00 |
1035.00 - 1035.00 |
0.3096 times |
Fri 29 August 2025 |
1027.80 (0.76%) |
1027.80 |
1027.80 - 1027.80 |
0.3276 times |
Weekly price and charts Efsl10 Strong weekly Stock price targets for Efsl10 940103 are 1058.4 and 1075.2 | Weekly Target 1 | 1044.4 | | Weekly Target 2 | 1055.6 | | Weekly Target 3 | 1061.2 | | Weekly Target 4 | 1072.4 | | Weekly Target 5 | 1078 |
Weekly price and volumes for Efsl 10
| Date |
Closing |
Open |
Range |
Volume |
Fri 05 December 2025 |
1066.80 (0.45%) |
1052.50 |
1050.00 - 1066.80 |
4.1788 times |
Thu 27 November 2025 |
1062.00 (0.76%) |
1054.00 |
1054.00 - 1062.00 |
1.5569 times |
Fri 14 November 2025 |
1054.00 (1.66%) |
1049.50 |
1049.50 - 1054.00 |
0.8201 times |
Thu 23 October 2025 |
1036.80 (2.43%) |
1020.20 |
1012.20 - 1036.80 |
0.8847 times |
Fri 19 September 2025 |
1012.20 (-1.52%) |
1035.00 |
1012.20 - 1035.00 |
0.2449 times |
Fri 29 August 2025 |
1027.80 (1.26%) |
1010.20 |
1010.20 - 1028.80 |
0.9263 times |
Wed 06 August 2025 |
1015.00 (0.59%) |
1009.00 |
1000.20 - 1015.00 |
0.6006 times |
Thu 17 July 2025 |
1009.00 (0.6%) |
1004.00 |
1004.00 - 1009.00 |
0.2703 times |
Fri 04 July 2025 |
1003.00 (0.58%) |
998.20 |
998.20 - 1003.00 |
0.3973 times |
Fri 30 May 2025 |
997.20 (-0.13%) |
983.00 |
983.00 - 997.20 |
0.1201 times |
Wed 21 May 2025 |
998.50 (0%) |
996.80 |
991.70 - 998.50 |
0.924 times |

Monthly price and charts Efsl10 Strong monthly Stock price targets for Efsl10 940103 are 1058.4 and 1075.2 | Monthly Target 1 | 1044.4 | | Monthly Target 2 | 1055.6 | | Monthly Target 3 | 1061.2 | | Monthly Target 4 | 1072.4 | | Monthly Target 5 | 1078 |
Monthly price and volumes Efsl 10
| Date |
Closing |
Open |
Range |
Volume |
Fri 05 December 2025 |
1066.80 (0.45%) |
1052.50 |
1050.00 - 1066.80 |
3.659 times |
Thu 27 November 2025 |
1062.00 (2.43%) |
1049.50 |
1049.50 - 1062.00 |
2.0813 times |
Thu 23 October 2025 |
1036.80 (2.43%) |
1020.20 |
1012.20 - 1036.80 |
0.7747 times |
Fri 19 September 2025 |
1012.20 (-1.52%) |
1035.00 |
1012.20 - 1035.00 |
0.2144 times |
Fri 29 August 2025 |
1027.80 (1.86%) |
1000.20 |
1000.20 - 1028.80 |
1.3167 times |
Tue 29 July 2025 |
1009.00 (1.08%) |
1003.00 |
1003.00 - 1009.00 |
0.445 times |
Tue 03 June 2025 |
998.20 (0.1%) |
998.20 |
998.20 - 998.20 |
0.1598 times |
Fri 30 May 2025 |
997.20 (1.65%) |
825.00 |
825.00 - 998.50 |
0.9547 times |
Thu 17 April 2025 |
981.00 (0%) |
981.00 |
981.00 - 981.00 |
0.2427 times |
Fri 28 March 2025 |
981.00 (-1.75%) |
990.00 |
981.00 - 990.00 |
0.1517 times |
Thu 13 February 2025 |
998.50 (0%) |
975.15 |
975.15 - 998.50 |
0.0405 times |

DMA SMA EMA moving averages of Efsl 10 940103
DMA (daily moving average) of Efsl 10 940103
| DMA period | DMA value | | 5 day DMA | 1059.41 | | 12 day DMA | 1041.69 | | 20 day DMA | 1027.3 | | 35 day DMA | | | 50 day DMA | | | 100 day DMA | | | 150 day DMA | | | 200 day DMA | | EMA (exponential moving average) of Efsl 10 940103
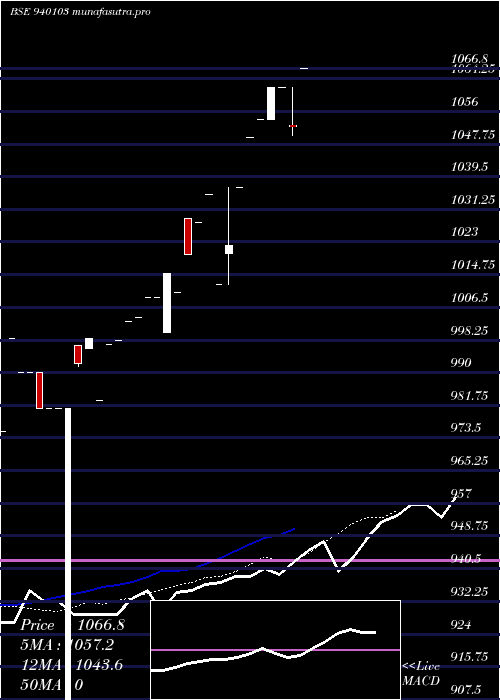
| EMA period | EMA current | EMA prev | EMA prev2 | | 5 day EMA | 1057.19 | 1052.38 | 1052.45 | | 12 day EMA | 1043.6 | 1039.38 | 1037.05 | | 20 day EMA | 1030.8 | 1027.01 | 1024.36 | | 35 day EMA | 0 | 0 | 0 | | 50 day EMA | 0 | 0 | 0 |
SMA (simple moving average) of Efsl 10 940103
| SMA period | SMA current | SMA prev | SMA prev2 | | 5 day SMA | 1059.41 | 1055.95 | 1052.86 | | 12 day SMA | 1041.69 | 1036.98 | 1033.87 | | 20 day SMA | 1027.3 | 1023.11 | 1020.42 | | 35 day SMA | | 50 day SMA | | 100 day SMA | | 150 day SMA | | 200 day SMA |
|
|
