Ccil12 940085 full analysis,charts,indicators,moving averages,SMA,DMA,EMA,ADX,MACD,RSICcil 12 940085 WideScreen charts, DMA,SMA,EMA technical analysis, forecast prediction, by indicators ADX,MACD,RSI,CCI BSE stock exchange
Daily price and charts and targets Ccil12 Strong Daily Stock price targets for Ccil12 940085 are 1008 and 1008 | Daily Target 1 | 1008 | | Daily Target 2 | 1008 | | Daily Target 3 | 1008 | | Daily Target 4 | 1008 | | Daily Target 5 | 1008 |
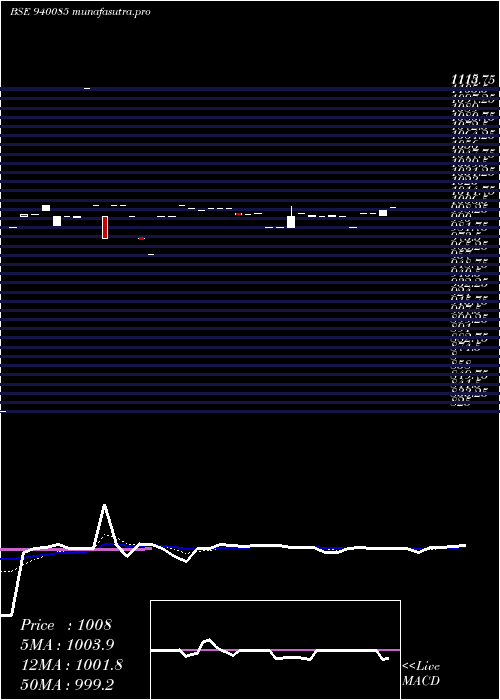
Daily price and volume Ccil 12
| Date |
Closing |
Open |
Range |
Volume |
Fri 05 December 2025 |
1008.00 (0.3%) |
1008.00 |
1008.00 - 1008.00 |
0.0364 times |
Wed 12 November 2025 |
1005.00 (0.2%) |
1001.00 |
1001.00 - 1005.00 |
1.8215 times |
Tue 11 November 2025 |
1003.00 (0%) |
1003.00 |
1003.00 - 1003.00 |
0.1093 times |
Mon 10 November 2025 |
1003.00 (1.31%) |
1003.00 |
1003.00 - 1003.00 |
0.2732 times |
Fri 31 October 2025 |
990.00 (-1%) |
990.00 |
990.00 - 990.00 |
1.4572 times |
Tue 28 October 2025 |
1000.00 (-0.1%) |
1000.00 |
1000.00 - 1000.00 |
1.0018 times |
Thu 23 October 2025 |
1001.00 (0.1%) |
1000.00 |
1000.00 - 1001.00 |
1.9854 times |
Tue 14 October 2025 |
1000.00 (-0.1%) |
1000.00 |
1000.00 - 1000.00 |
0.3643 times |
Wed 24 September 2025 |
1001.00 (-0.2%) |
1000.00 |
1000.00 - 1001.00 |
2.7869 times |
Tue 23 September 2025 |
1003.00 (0.3%) |
1003.00 |
1003.00 - 1003.00 |
0.1639 times |
Fri 19 September 2025 |
1000.00 (1.01%) |
990.00 |
990.00 - 1009.00 |
10.3825 times |
Weekly price and charts Ccil12 Strong weekly Stock price targets for Ccil12 940085 are 1004.5 and 1011.5 | Weekly Target 1 | 998.67 | | Weekly Target 2 | 1003.33 | | Weekly Target 3 | 1005.6666666667 | | Weekly Target 4 | 1010.33 | | Weekly Target 5 | 1012.67 |
Weekly price and volumes for Ccil 12
| Date |
Closing |
Open |
Range |
Volume |
Fri 05 December 2025 |
1008.00 (1.82%) |
1003.00 |
1001.00 - 1008.00 |
0.5734 times |
Fri 31 October 2025 |
990.00 (-1.1%) |
1000.00 |
990.00 - 1000.00 |
0.6294 times |
Thu 23 October 2025 |
1001.00 (0%) |
1000.00 |
1000.00 - 1001.00 |
0.6014 times |
Wed 24 September 2025 |
1001.00 (0.1%) |
1003.00 |
1000.00 - 1003.00 |
0.7552 times |
Fri 19 September 2025 |
1000.00 (-0.3%) |
990.00 |
990.00 - 1009.00 |
4.6294 times |
Fri 12 September 2025 |
1003.00 (-0.4%) |
1007.00 |
1002.00 - 1007.00 |
0.7273 times |
Thu 04 September 2025 |
1007.00 (-0.3%) |
1007.00 |
1005.00 - 1007.00 |
0.4615 times |
Tue 26 August 2025 |
1010.00 (1%) |
1000.00 |
1000.00 - 1010.00 |
0.9324 times |
Fri 22 August 2025 |
1000.00 (0%) |
980.19 |
966.06 - 1000.00 |
0.6807 times |
Wed 06 August 2025 |
1000.00 (-0.99%) |
1000.00 |
1000.00 - 1000.00 |
0.0093 times |
Fri 01 August 2025 |
1010.00 (-9.42%) |
1010.00 |
980.00 - 1010.00 |
0.1212 times |

Monthly price and charts Ccil12 Strong monthly Stock price targets for Ccil12 940085 are 1008 and 1008 | Monthly Target 1 | 1008 | | Monthly Target 2 | 1008 | | Monthly Target 3 | 1008 | | Monthly Target 4 | 1008 | | Monthly Target 5 | 1008 |
Monthly price and volumes Ccil 12
| Date |
Closing |
Open |
Range |
Volume |
Fri 05 December 2025 |
1008.00 (0.3%) |
1008.00 |
1008.00 - 1008.00 |
0.0036 times |
Wed 12 November 2025 |
1005.00 (1.52%) |
1003.00 |
1001.00 - 1005.00 |
0.2207 times |
Fri 31 October 2025 |
990.00 (-1.1%) |
1000.00 |
990.00 - 1001.00 |
0.4815 times |
Wed 24 September 2025 |
1001.00 (-0.89%) |
1007.00 |
990.00 - 1009.00 |
2.5716 times |
Tue 26 August 2025 |
1010.00 (0%) |
1010.00 |
966.06 - 1010.00 |
0.6365 times |
Wed 30 July 2025 |
1010.00 (0%) |
992.01 |
980.00 - 1115.00 |
0.3556 times |
Tue 24 June 2025 |
1010.00 (0.8%) |
825.00 |
825.00 - 1010.00 |
1.2511 times |
Tue 13 May 2025 |
1002.00 (1.21%) |
990.00 |
990.00 - 1002.00 |
1.4153 times |
Fri 25 April 2025 |
990.00 (0.41%) |
986.00 |
986.00 - 990.00 |
1.0159 times |
Mon 24 March 2025 |
986.00 (-1.89%) |
1002.00 |
986.00 - 1005.00 |
2.0481 times |
Fri 28 February 2025 |
1005.00 (0%) |
1005.00 |
999.90 - 1005.00 |
0.6365 times |

DMA SMA EMA moving averages of Ccil 12 940085
DMA (daily moving average) of Ccil 12 940085
| DMA period | DMA value | | 5 day DMA | 1001.8 | | 12 day DMA | 1000.33 | | 20 day DMA | 1001.35 | | 35 day DMA | 1003.29 | | 50 day DMA | 998.04 | | 100 day DMA | | | 150 day DMA | | | 200 day DMA | | EMA (exponential moving average) of Ccil 12 940085
| EMA period | EMA current | EMA prev | EMA prev2 | | 5 day EMA | 1003.88 | 1001.82 | 1000.23 | | 12 day EMA | 1001.81 | 1000.68 | 999.89 | | 20 day EMA | 1001.2 | 1000.49 | 1000.01 | | 35 day EMA | 999.71 | 999.22 | 998.88 | | 50 day EMA | 998.58 | 998.2 | 997.92 |
SMA (simple moving average) of Ccil 12 940085
| SMA period | SMA current | SMA prev | SMA prev2 | | 5 day SMA | 1001.8 | 1000.2 | 999.4 | | 12 day SMA | 1000.33 | 998.83 | 998.67 | | 20 day SMA | 1001.35 | 1001.3 | 1001.55 | | 35 day SMA | 1003.29 | 1003.34 | 1003.26 | | 50 day SMA | 998.04 | 997.78 | 997.59 | | 100 day SMA | | 150 day SMA | | 200 day SMA |
|
|
