1090nfl26 939333 full analysis,charts,indicators,moving averages,SMA,DMA,EMA,ADX,MACD,RSI1090nfl26 939333 WideScreen charts, DMA,SMA,EMA technical analysis, forecast prediction, by indicators ADX,MACD,RSI,CCI BSE stock exchange
Daily price and charts and targets 1090nfl26 Strong Daily Stock price targets for 1090nfl26 939333 are 1047.5 and 1047.5 | Daily Target 1 | 1047.5 | | Daily Target 2 | 1047.5 | | Daily Target 3 | 1047.5 | | Daily Target 4 | 1047.5 | | Daily Target 5 | 1047.5 |
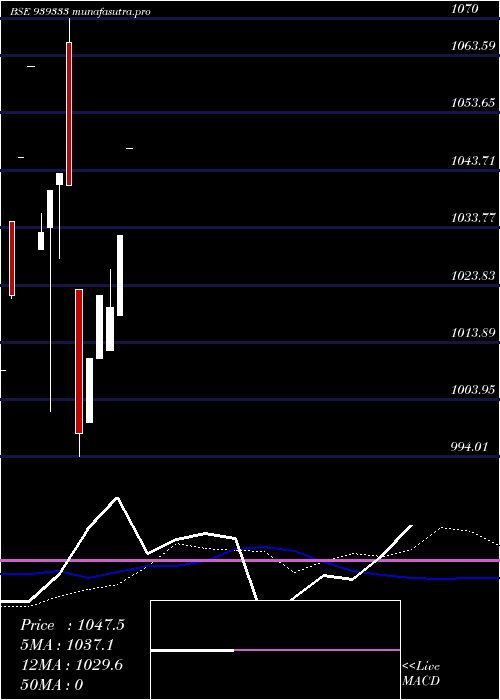
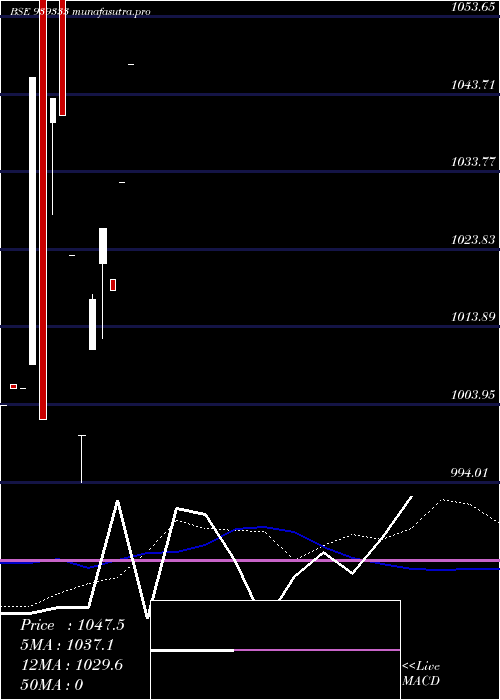
Daily price and volume 1090nfl26
| Date |
Closing |
Open |
Range |
Volume |
Wed 03 September 2025 |
1047.50 (0%) |
1047.50 |
1047.50 - 1047.50 |
0.3023 times |
Tue 02 September 2025 |
1047.50 (1.47%) |
1047.50 |
1047.50 - 1047.50 |
0.0047 times |
Tue 12 August 2025 |
1032.32 (1.36%) |
1032.32 |
1032.32 - 1032.32 |
0.0465 times |
Mon 07 July 2025 |
1018.50 (-0.15%) |
1018.50 |
1018.50 - 1018.50 |
0.0465 times |
Fri 04 July 2025 |
1020.00 (-0.63%) |
1020.00 |
1020.00 - 1020.00 |
0.0651 times |
Tue 17 June 2025 |
1026.49 (0.61%) |
1019.90 |
1019.90 - 1026.49 |
3.4977 times |
Mon 16 June 2025 |
1020.25 (-0.17%) |
1012.50 |
1012.50 - 1020.25 |
5.107 times |
Fri 13 June 2025 |
1021.97 (0.45%) |
1021.97 |
1021.97 - 1021.97 |
0.4651 times |
Thu 29 May 2025 |
1017.40 (0.63%) |
1018.00 |
1017.40 - 1018.00 |
0.2326 times |
Wed 28 May 2025 |
1011.06 (0%) |
1011.06 |
1011.06 - 1011.06 |
0.2326 times |
Thu 08 May 2025 |
1011.06 (1.11%) |
1011.06 |
1011.06 - 1011.06 |
0.4651 times |

Weekly price and charts 1090nfl26 Strong weekly Stock price targets for 1090nfl26 939333 are 1047.5 and 1047.5 | Weekly Target 1 | 1047.5 | | Weekly Target 2 | 1047.5 | | Weekly Target 3 | 1047.5 | | Weekly Target 4 | 1047.5 | | Weekly Target 5 | 1047.5 |
Weekly price and volumes for 1090nfl26
| Date |
Closing |
Open |
Range |
Volume |
Wed 03 September 2025 |
1047.50 (1.47%) |
1047.50 |
1047.50 - 1047.50 |
0.2072 times |
Tue 12 August 2025 |
1032.32 (1.21%) |
1018.50 |
1018.50 - 1032.32 |
0.0628 times |
Fri 04 July 2025 |
1020.00 (-0.19%) |
1012.50 |
1012.50 - 1026.49 |
5.8524 times |
Fri 13 June 2025 |
1021.97 (1.08%) |
1011.06 |
1011.06 - 1021.97 |
0.6279 times |
Thu 08 May 2025 |
1011.06 (1.31%) |
1000.00 |
1000.00 - 1011.06 |
0.5777 times |
Fri 25 April 2025 |
998.00 (-4.13%) |
1023.00 |
994.01 - 1023.00 |
1.8305 times |
Fri 31 January 2025 |
1041.00 (-0.2%) |
1065.84 |
1041.00 - 1070.00 |
0.4427 times |
Thu 21 November 2024 |
1043.09 (0.28%) |
1041.19 |
1028.40 - 1043.09 |
0.1538 times |
Fri 01 November 2024 |
1040.14 (0.69%) |
1033.70 |
1002.00 - 1040.14 |
0.1413 times |
Tue 22 October 2024 |
1032.97 (-2.71%) |
1030.00 |
1030.00 - 1036.25 |
0.1036 times |
Wed 16 October 2024 |
1061.73 (1.52%) |
1061.73 |
1061.73 - 1061.73 |
1.4129 times |
Monthly price and charts 1090nfl26 Strong monthly Stock price targets for 1090nfl26 939333 are 1047.5 and 1047.5 | Monthly Target 1 | 1047.5 | | Monthly Target 2 | 1047.5 | | Monthly Target 3 | 1047.5 | | Monthly Target 4 | 1047.5 | | Monthly Target 5 | 1047.5 |
Monthly price and volumes 1090nfl26
| Date |
Closing |
Open |
Range |
Volume |
Wed 03 September 2025 |
1047.50 (1.47%) |
1047.50 |
1047.50 - 1047.50 |
0.1816 times |
Tue 12 August 2025 |
1032.32 (1.36%) |
1032.32 |
1032.32 - 1032.32 |
0.0275 times |
Mon 07 July 2025 |
1018.50 (-0.78%) |
1020.00 |
1018.50 - 1020.00 |
0.066 times |
Tue 17 June 2025 |
1026.49 (0.89%) |
1021.97 |
1012.50 - 1026.49 |
5.3645 times |
Thu 29 May 2025 |
1017.40 (1.74%) |
1011.06 |
1011.06 - 1018.00 |
0.5502 times |
Tue 29 April 2025 |
1000.00 (-2.25%) |
1000.00 |
994.01 - 1000.00 |
1.8267 times |
Tue 04 March 2025 |
1023.00 (-1.73%) |
1023.00 |
1023.00 - 1023.00 |
0.0083 times |
Fri 31 January 2025 |
1041.00 (-0.2%) |
1065.84 |
1041.00 - 1070.00 |
0.3879 times |
Thu 21 November 2024 |
1043.09 (4.1%) |
1040.14 |
1028.40 - 1043.09 |
0.1376 times |
Wed 30 October 2024 |
1002.00 (-4.19%) |
1061.73 |
1002.00 - 1061.73 |
1.4498 times |
Wed 18 September 2024 |
1045.84 (3.96%) |
1009.10 |
1009.10 - 1045.84 |
0.3576 times |
DMA SMA EMA moving averages of 1090nfl26 939333
DMA (daily moving average) of 1090nfl26 939333
| DMA period | DMA value | | 5 day DMA | 1033.16 | | 12 day DMA | 1022.84 | | 20 day DMA | 1027.84 | | 35 day DMA | | | 50 day DMA | | | 100 day DMA | | | 150 day DMA | | | 200 day DMA | | EMA (exponential moving average) of 1090nfl26 939333
| EMA period | EMA current | EMA prev | EMA prev2 | | 5 day EMA | 1037.08 | 1031.87 | 1024.05 | | 12 day EMA | 1029.55 | 1026.29 | 1022.44 | | 20 day EMA | 1026.4 | 1024.18 | 1021.73 | | 35 day EMA | 0 | 0 | 0 | | 50 day EMA | 0 | 0 | 0 |
SMA (simple moving average) of 1090nfl26 939333
| SMA period | SMA current | SMA prev | SMA prev2 | | 5 day SMA | 1033.16 | 1028.96 | 1023.51 | | 12 day SMA | 1022.84 | 1018.71 | 1016.67 | | 20 day SMA | 1027.84 | 1025.57 | 1024.88 | | 35 day SMA | | 50 day SMA | | 100 day SMA | | 150 day SMA | | 200 day SMA |
|
|
