1150iml29 939264 full analysis,charts,indicators,moving averages,SMA,DMA,EMA,ADX,MACD,RSI1150iml29 939264 WideScreen charts, DMA,SMA,EMA technical analysis, forecast prediction, by indicators ADX,MACD,RSI,CCI BSE stock exchange
Daily price and charts and targets 1150iml29 Strong Daily Stock price targets for 1150iml29 939264 are 1008.5 and 1011.5 | Daily Target 1 | 1006 | | Daily Target 2 | 1008 | | Daily Target 3 | 1009 | | Daily Target 4 | 1011 | | Daily Target 5 | 1012 |
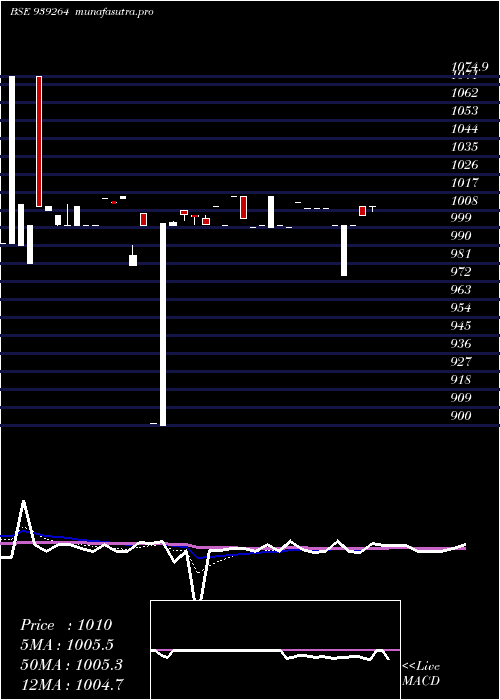
Daily price and volume 1150iml29
| Date |
Closing |
Open |
Range |
Volume |
Thu 23 October 2025 |
1010.00 (0.5%) |
1009.90 |
1007.00 - 1010.00 |
5.1435 times |
Mon 20 October 2025 |
1005.00 (0.5%) |
1010.00 |
1005.00 - 1010.00 |
0.4636 times |
Fri 03 October 2025 |
1000.00 (0%) |
1000.00 |
1000.00 - 1000.00 |
0.1104 times |
Mon 29 September 2025 |
1000.00 (0%) |
975.00 |
975.00 - 1000.00 |
0.0442 times |
Fri 26 September 2025 |
1000.00 (-0.89%) |
1000.00 |
1000.00 - 1000.00 |
0.011 times |
Thu 18 September 2025 |
1009.00 (0%) |
1009.00 |
1009.00 - 1009.00 |
0.1104 times |
Mon 15 September 2025 |
1009.00 (0%) |
1009.00 |
1009.00 - 1009.00 |
0.7174 times |
Fri 12 September 2025 |
1009.00 (-0.3%) |
1009.00 |
1009.00 - 1009.00 |
2.9691 times |
Wed 10 September 2025 |
1012.00 (1.3%) |
1012.00 |
1012.00 - 1012.00 |
0.3201 times |
Thu 04 September 2025 |
999.00 (-0.1%) |
999.00 |
999.00 - 999.00 |
0.1104 times |
Mon 01 September 2025 |
1000.00 (-1.48%) |
1000.00 |
1000.00 - 1000.00 |
0.0662 times |
Weekly price and charts 1150iml29 Strong weekly Stock price targets for 1150iml29 939264 are 1007.5 and 1012.5 | Weekly Target 1 | 1003.33 | | Weekly Target 2 | 1006.67 | | Weekly Target 3 | 1008.3333333333 | | Weekly Target 4 | 1011.67 | | Weekly Target 5 | 1013.33 |
Weekly price and volumes for 1150iml29
| Date |
Closing |
Open |
Range |
Volume |
Thu 23 October 2025 |
1010.00 (1%) |
1010.00 |
1005.00 - 1010.00 |
0.9629 times |
Fri 03 October 2025 |
1000.00 (0%) |
975.00 |
975.00 - 1000.00 |
0.0265 times |
Fri 26 September 2025 |
1000.00 (-0.89%) |
1009.00 |
1000.00 - 1009.00 |
0.144 times |
Fri 12 September 2025 |
1009.00 (1%) |
1012.00 |
1009.00 - 1012.00 |
0.5648 times |
Thu 04 September 2025 |
999.00 (-1.58%) |
1000.00 |
999.00 - 1000.00 |
0.0303 times |
Fri 29 August 2025 |
1015.00 (0%) |
1015.00 |
999.00 - 1015.00 |
0.5781 times |
Tue 12 August 2025 |
1015.00 (1.5%) |
1015.00 |
1015.00 - 1015.00 |
0.0019 times |
Fri 08 August 2025 |
1000.00 (-0.2%) |
1008.00 |
1000.00 - 1010.00 |
3.7244 times |
Fri 01 August 2025 |
1002.01 (0.2%) |
901.01 |
900.00 - 1002.50 |
1.9788 times |
Fri 25 July 2025 |
1000.00 (-1.18%) |
1014.00 |
980.01 - 1014.90 |
1.9882 times |
Fri 18 July 2025 |
1011.89 (1.19%) |
1000.00 |
1000.00 - 1013.80 |
0.3734 times |

Monthly price and charts 1150iml29 Strong monthly Stock price targets for 1150iml29 939264 are 1005 and 1015 | Monthly Target 1 | 996.67 | | Monthly Target 2 | 1003.33 | | Monthly Target 3 | 1006.6666666667 | | Monthly Target 4 | 1013.33 | | Monthly Target 5 | 1016.67 |
Monthly price and volumes 1150iml29
| Date |
Closing |
Open |
Range |
Volume |
Thu 23 October 2025 |
1010.00 (1%) |
1000.00 |
1000.00 - 1010.00 |
0.5221 times |
Mon 29 September 2025 |
1000.00 (-1.48%) |
1000.00 |
975.00 - 1012.00 |
0.3971 times |
Fri 29 August 2025 |
1015.00 (1.36%) |
1000.00 |
999.00 - 1015.00 |
3.074 times |
Wed 30 July 2025 |
1001.43 (0.14%) |
1074.90 |
900.00 - 1074.90 |
2.1347 times |
Tue 24 June 2025 |
1000.00 (-3.85%) |
1025.00 |
981.00 - 1074.90 |
0.2207 times |
Wed 21 May 2025 |
1040.00 (-6.39%) |
1083.23 |
1001.00 - 1083.23 |
0.0988 times |
Wed 30 April 2025 |
1111.00 (11.1%) |
1010.00 |
991.00 - 1111.00 |
0.3991 times |
Fri 28 March 2025 |
1000.00 (-4.75%) |
1000.00 |
970.00 - 1049.90 |
1.797 times |
Fri 28 February 2025 |
1049.90 (4.99%) |
1000.00 |
995.00 - 1049.90 |
1.3415 times |
Fri 10 January 2025 |
1000.00 (1.5%) |
1009.83 |
1000.00 - 1009.83 |
0.0151 times |
Thu 19 December 2024 |
985.20 (0.07%) |
995.00 |
984.00 - 1000.00 |
1.1086 times |

DMA SMA EMA moving averages of 1150iml29 939264
DMA (daily moving average) of 1150iml29 939264
| DMA period | DMA value | | 5 day DMA | 1003 | | 12 day DMA | 1005.67 | | 20 day DMA | 1005.1 | | 35 day DMA | 1001.79 | | 50 day DMA | 1010.45 | | 100 day DMA | 1005.66 | | 150 day DMA | 1002.98 | | 200 day DMA | | EMA (exponential moving average) of 1150iml29 939264
| EMA period | EMA current | EMA prev | EMA prev2 | | 5 day EMA | 1005.5 | 1003.25 | 1002.38 | | 12 day EMA | 1004.74 | 1003.78 | 1003.56 | | 20 day EMA | 1004.52 | 1003.94 | 1003.83 | | 35 day EMA | 1007.5 | 1007.35 | 1007.49 | | 50 day EMA | 1009.25 | 1009.22 | 1009.39 |
SMA (simple moving average) of 1150iml29 939264
| SMA period | SMA current | SMA prev | SMA prev2 | | 5 day SMA | 1003 | 1002.8 | 1003.6 | | 12 day SMA | 1005.67 | 1004.83 | 1004.33 | | 20 day SMA | 1005.1 | 1004.87 | 1004.73 | | 35 day SMA | 1001.79 | 1001.79 | 1001.64 | | 50 day SMA | 1010.45 | 1010.07 | 1009.97 | | 100 day SMA | 1005.66 | 1005.53 | 1005.58 | | 150 day SMA | 1002.98 | 1002.85 | 1002.83 | | 200 day SMA |
|
|
