10efs33 938664 full analysis,charts,indicators,moving averages,SMA,DMA,EMA,ADX,MACD,RSI10efs33 938664 WideScreen charts, DMA,SMA,EMA technical analysis, forecast prediction, by indicators ADX,MACD,RSI,CCI BSE stock exchange
Daily price and charts and targets 10efs33 Strong Daily Stock price targets for 10efs33 938664 are 962.04 and 971.74 | Daily Target 1 | 959.89 | | Daily Target 2 | 964.18 | | Daily Target 3 | 969.59 | | Daily Target 4 | 973.88 | | Daily Target 5 | 979.29 |
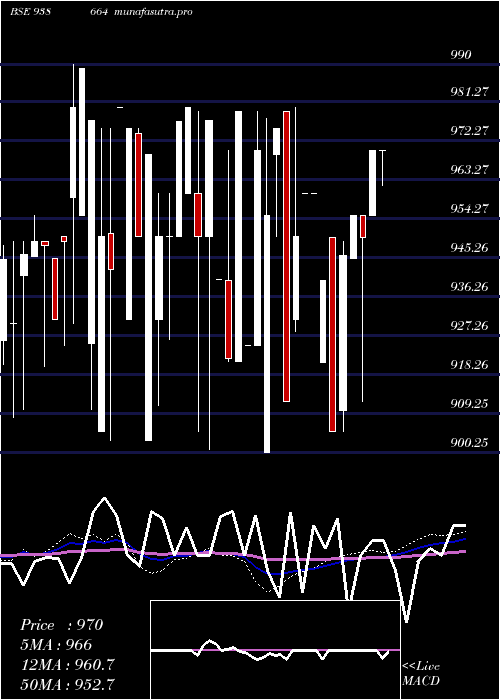
Daily price and volume 10efs33
| Date |
Closing |
Open |
Range |
Volume |
Mon 20 October 2025 |
968.47 (0.68%) |
975.00 |
965.30 - 975.00 |
0.4168 times |
Fri 17 October 2025 |
961.94 (-1.03%) |
960.10 |
960.10 - 970.00 |
1.2072 times |
Thu 16 October 2025 |
972.00 (0.21%) |
967.00 |
960.70 - 972.00 |
2.1746 times |
Wed 15 October 2025 |
970.00 (-2.99%) |
970.00 |
970.00 - 970.00 |
0.7865 times |
Mon 13 October 2025 |
999.85 (3.08%) |
970.00 |
970.00 - 999.85 |
0.1062 times |
Wed 08 October 2025 |
970.00 (-2.99%) |
980.00 |
961.40 - 980.00 |
0.7275 times |
Mon 06 October 2025 |
999.90 (1.51%) |
999.00 |
999.00 - 999.90 |
3.1498 times |
Mon 29 September 2025 |
985.00 (0.1%) |
985.00 |
970.00 - 990.00 |
0.8022 times |
Wed 24 September 2025 |
984.00 (-1.59%) |
984.00 |
984.00 - 984.00 |
0.1966 times |
Wed 17 September 2025 |
999.90 (0.5%) |
999.00 |
999.00 - 999.90 |
0.4326 times |
Fri 12 September 2025 |
994.92 (3.64%) |
999.00 |
994.70 - 999.85 |
0.8258 times |

Weekly price and charts 10efs33 Strong weekly Stock price targets for 10efs33 938664 are 962.04 and 971.74 | Weekly Target 1 | 959.89 | | Weekly Target 2 | 964.18 | | Weekly Target 3 | 969.59 | | Weekly Target 4 | 973.88 | | Weekly Target 5 | 979.29 |
Weekly price and volumes for 10efs33
| Date |
Closing |
Open |
Range |
Volume |
Mon 20 October 2025 |
968.47 (0.68%) |
975.00 |
965.30 - 975.00 |
0.2551 times |
Fri 17 October 2025 |
961.94 (-0.83%) |
970.00 |
960.10 - 999.85 |
2.6155 times |
Wed 08 October 2025 |
970.00 (-1.52%) |
999.00 |
961.40 - 999.90 |
2.3725 times |
Mon 29 September 2025 |
985.00 (0.1%) |
985.00 |
970.00 - 990.00 |
0.4909 times |
Wed 24 September 2025 |
984.00 (-1.59%) |
984.00 |
984.00 - 984.00 |
0.1203 times |
Wed 17 September 2025 |
999.90 (0.5%) |
999.00 |
999.00 - 999.90 |
0.2647 times |
Fri 12 September 2025 |
994.92 (3.1%) |
975.00 |
960.00 - 999.90 |
2.2907 times |
Fri 29 August 2025 |
965.00 (-1.03%) |
975.00 |
965.00 - 975.00 |
0.2671 times |
Fri 22 August 2025 |
975.00 (-1.02%) |
975.00 |
955.50 - 975.00 |
0.8373 times |
Thu 14 August 2025 |
985.00 (1.55%) |
956.90 |
956.90 - 985.00 |
0.486 times |
Fri 08 August 2025 |
970.00 (0.36%) |
966.50 |
955.30 - 999.00 |
2.8922 times |
Monthly price and charts 10efs33 Strong monthly Stock price targets for 10efs33 938664 are 944.39 and 984.19 | Monthly Target 1 | 936.36 | | Monthly Target 2 | 952.41 | | Monthly Target 3 | 976.15666666667 | | Monthly Target 4 | 992.21 | | Monthly Target 5 | 1015.96 |
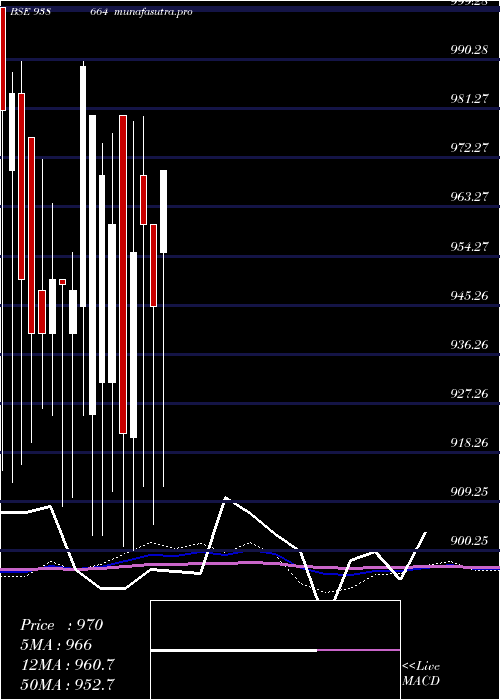
Monthly price and volumes 10efs33
| Date |
Closing |
Open |
Range |
Volume |
Mon 20 October 2025 |
968.47 (-1.68%) |
999.00 |
960.10 - 999.90 |
0.8262 times |
Mon 29 September 2025 |
985.00 (2.07%) |
975.00 |
960.00 - 999.90 |
0.499 times |
Fri 29 August 2025 |
965.00 (-0.16%) |
966.50 |
955.30 - 999.00 |
0.7064 times |
Mon 28 July 2025 |
966.50 (-0.36%) |
979.90 |
952.20 - 999.90 |
1.6168 times |
Mon 30 June 2025 |
970.00 (-0.05%) |
975.00 |
920.00 - 990.00 |
0.2184 times |
Fri 30 May 2025 |
970.49 (2.7%) |
955.00 |
912.01 - 975.00 |
1.1318 times |
Tue 29 April 2025 |
945.00 (-1.56%) |
960.00 |
905.00 - 960.00 |
0.9555 times |
Tue 25 March 2025 |
960.00 (0.52%) |
969.00 |
912.01 - 979.90 |
0.579 times |
Fri 28 February 2025 |
955.00 (3.61%) |
921.10 |
900.25 - 979.00 |
0.5729 times |
Fri 31 January 2025 |
921.76 (-3.98%) |
979.99 |
901.00 - 979.99 |
2.8939 times |
Mon 30 December 2024 |
960.00 (-0.93%) |
931.00 |
911.05 - 976.75 |
1.897 times |
DMA SMA EMA moving averages of 10efs33 938664
DMA (daily moving average) of 10efs33 938664
| DMA period | DMA value | | 5 day DMA | 974.45 | | 12 day DMA | 980.5 | | 20 day DMA | 978.64 | | 35 day DMA | 974.27 | | 50 day DMA | 972.83 | | 100 day DMA | 962.03 | | 150 day DMA | 958.34 | | 200 day DMA | 954.8 | EMA (exponential moving average) of 10efs33 938664
| EMA period | EMA current | EMA prev | EMA prev2 | | 5 day EMA | 971.76 | 973.41 | 979.15 | | 12 day EMA | 976.5 | 977.96 | 980.87 | | 20 day EMA | 976.72 | 977.59 | 979.24 | | 35 day EMA | 975.44 | 975.85 | 976.67 | | 50 day EMA | 972.46 | 972.62 | 973.06 |
SMA (simple moving average) of 10efs33 938664
| SMA period | SMA current | SMA prev | SMA prev2 | | 5 day SMA | 974.45 | 974.76 | 982.35 | | 12 day SMA | 980.5 | 983.12 | 984.21 | | 20 day SMA | 978.64 | 978.72 | 979.62 | | 35 day SMA | 974.27 | 974.31 | 974.8 | | 50 day SMA | 972.83 | 972.86 | 972.92 | | 100 day SMA | 962.03 | 961.88 | 961.76 | | 150 day SMA | 958.34 | 958.25 | 958.14 | | 200 day SMA | 954.8 | 954.67 | 954.61 |
|
|
