1010efs28 938660 full analysis,charts,indicators,moving averages,SMA,DMA,EMA,ADX,MACD,RSI1010efs28 938660 WideScreen charts, DMA,SMA,EMA technical analysis, forecast prediction, by indicators ADX,MACD,RSI,CCI BSE stock exchange
Daily price and charts and targets 1010efs28 Strong Daily Stock price targets for 1010efs28 938660 are 1020.2 and 1020.2 | Daily Target 1 | 1020.2 | | Daily Target 2 | 1020.2 | | Daily Target 3 | 1020.2 | | Daily Target 4 | 1020.2 | | Daily Target 5 | 1020.2 |
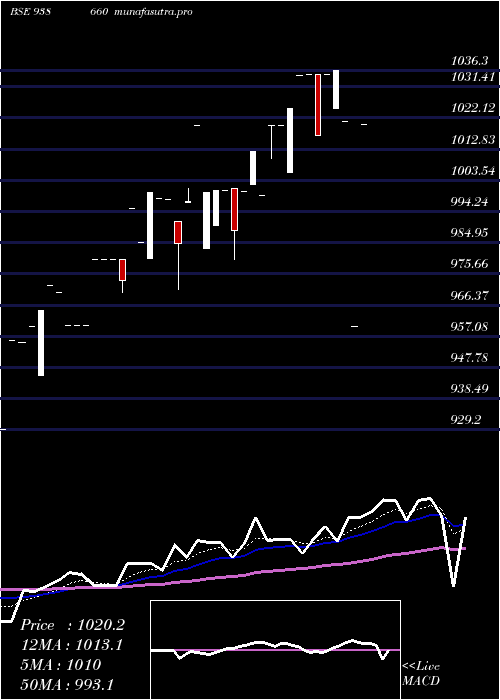
Daily price and volume 1010efs28
| Date |
Closing |
Open |
Range |
Volume |
Fri 11 July 2025 |
1020.20 (6.27%) |
1020.20 |
1020.20 - 1020.20 |
0.0505 times |
Thu 10 July 2025 |
960.00 (-5.99%) |
960.00 |
960.00 - 960.00 |
0.2525 times |
Fri 30 May 2025 |
1021.20 (-1.46%) |
1021.20 |
1021.20 - 1021.20 |
0.0505 times |
Wed 28 May 2025 |
1036.30 (0.13%) |
1025.00 |
1025.00 - 1036.30 |
4.0404 times |
Wed 21 May 2025 |
1035.00 (1.79%) |
1035.00 |
1035.00 - 1035.00 |
0.6818 times |
Tue 20 May 2025 |
1016.80 (-1.76%) |
1035.00 |
1016.80 - 1035.00 |
0.7424 times |
Mon 19 May 2025 |
1035.00 (0.02%) |
1035.00 |
1035.00 - 1035.00 |
0.1162 times |
Tue 06 May 2025 |
1034.80 (0.98%) |
1034.80 |
1034.80 - 1034.80 |
0.4798 times |
Mon 05 May 2025 |
1024.80 (0.47%) |
1005.80 |
1005.80 - 1024.80 |
3.5354 times |
Fri 02 May 2025 |
1020.00 (0%) |
1020.00 |
1020.00 - 1020.00 |
0.0505 times |
Fri 25 April 2025 |
1020.00 (2.1%) |
1020.00 |
1010.00 - 1020.00 |
3.8182 times |
Weekly price and charts 1010efs28 Strong weekly Stock price targets for 1010efs28 938660 are 990.1 and 1050.3 | Weekly Target 1 | 939.93 | | Weekly Target 2 | 980.07 | | Weekly Target 3 | 1000.1333333333 | | Weekly Target 4 | 1040.27 | | Weekly Target 5 | 1060.33 |
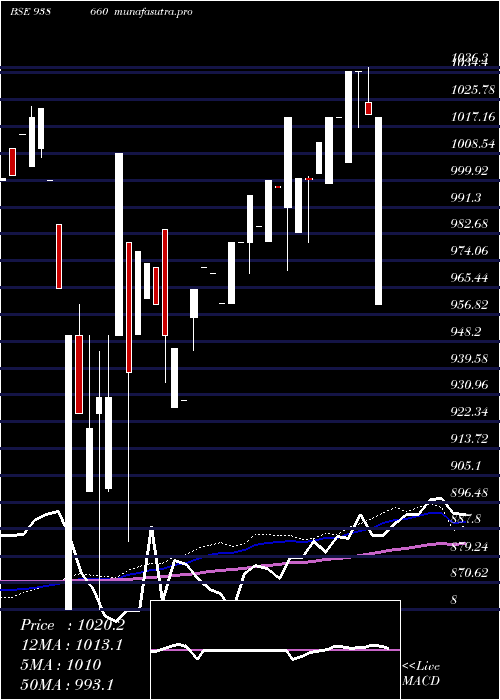
Weekly price and volumes for 1010efs28
| Date |
Closing |
Open |
Range |
Volume |
Fri 11 July 2025 |
1020.20 (-0.1%) |
960.00 |
960.00 - 1020.20 |
0.038 times |
Fri 30 May 2025 |
1021.20 (-1.33%) |
1025.00 |
1021.20 - 1036.30 |
0.5125 times |
Wed 21 May 2025 |
1035.00 (0.02%) |
1035.00 |
1016.80 - 1035.00 |
0.193 times |
Tue 06 May 2025 |
1034.80 (1.45%) |
1005.80 |
1005.80 - 1034.80 |
0.503 times |
Fri 02 May 2025 |
1020.00 (0%) |
1020.00 |
1020.00 - 1020.00 |
0.0063 times |
Fri 25 April 2025 |
1020.00 (0.78%) |
999.00 |
999.00 - 1020.00 |
0.6682 times |
Thu 17 April 2025 |
1012.09 (1.19%) |
1002.20 |
1002.20 - 1012.09 |
0.1209 times |
Fri 11 April 2025 |
1000.20 (-0.03%) |
1000.48 |
980.00 - 1001.00 |
0.722 times |
Fri 04 April 2025 |
1000.48 (-1.91%) |
983.20 |
983.20 - 1000.48 |
0.1898 times |
Fri 21 March 2025 |
1020.00 (2.22%) |
991.11 |
970.95 - 1020.00 |
7.0463 times |
Thu 13 March 2025 |
997.80 (-0.2%) |
998.00 |
997.80 - 998.00 |
0.0917 times |
Monthly price and charts 1010efs28 Strong monthly Stock price targets for 1010efs28 938660 are 990.1 and 1050.3 | Monthly Target 1 | 939.93 | | Monthly Target 2 | 980.07 | | Monthly Target 3 | 1000.1333333333 | | Monthly Target 4 | 1040.27 | | Monthly Target 5 | 1060.33 |
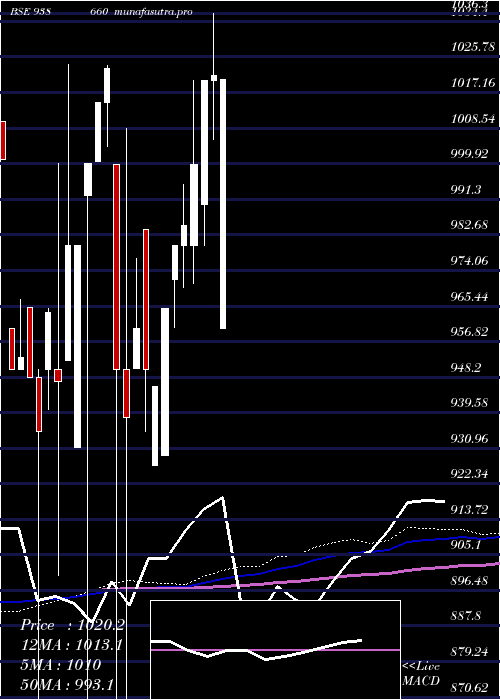
Monthly price and volumes 1010efs28
| Date |
Closing |
Open |
Range |
Volume |
Fri 11 July 2025 |
1020.20 (-0.1%) |
960.00 |
960.00 - 1020.20 |
0.0153 times |
Fri 30 May 2025 |
1021.20 (0.12%) |
1020.00 |
1005.80 - 1036.30 |
0.4906 times |
Fri 25 April 2025 |
1020.00 (2.02%) |
990.00 |
980.00 - 1020.00 |
0.6357 times |
Wed 26 March 2025 |
999.80 (1.5%) |
980.20 |
970.95 - 1020.00 |
2.9809 times |
Tue 25 February 2025 |
985.00 (0.51%) |
980.00 |
970.00 - 995.00 |
0.1086 times |
Thu 23 January 2025 |
980.00 (1.58%) |
972.00 |
960.20 - 980.00 |
0.1112 times |
Fri 27 December 2024 |
964.80 (2.01%) |
929.20 |
929.20 - 964.80 |
5.5951 times |
Fri 08 November 2024 |
945.80 (-0.44%) |
926.80 |
926.80 - 945.80 |
0.036 times |
Tue 22 October 2024 |
950.00 (-1.04%) |
984.00 |
935.00 - 984.00 |
0.0079 times |
Thu 19 September 2024 |
960.00 (2.31%) |
950.30 |
950.30 - 977.00 |
0.0187 times |
Fri 30 August 2024 |
938.30 (-1.23%) |
950.00 |
862.00 - 1008.58 |
1.3571 times |
DMA SMA EMA moving averages of 1010efs28 938660
DMA (daily moving average) of 1010efs28 938660
| DMA period | DMA value | | 5 day DMA | 1014.54 | | 12 day DMA | 1018.59 | | 20 day DMA | 1012.1 | | 35 day DMA | 998.24 | | 50 day DMA | 986.15 | | 100 day DMA | 976.47 | | 150 day DMA | | | 200 day DMA | | EMA (exponential moving average) of 1010efs28 938660
| EMA period | EMA current | EMA prev | EMA prev2 | | 5 day EMA | 1009.95 | 1004.82 | 1027.22 | | 12 day EMA | 1013.04 | 1011.74 | 1021.14 | | 20 day EMA | 1009.16 | 1008 | 1013.05 | | 35 day EMA | 997.87 | 996.56 | 998.71 | | 50 day EMA | 984.78 | 983.33 | 984.28 |
SMA (simple moving average) of 1010efs28 938660
| SMA period | SMA current | SMA prev | SMA prev2 | | 5 day SMA | 1014.54 | 1013.86 | 1028.86 | | 12 day SMA | 1018.59 | 1017.92 | 1021.27 | | 20 day SMA | 1012.1 | 1010.32 | 1012.21 | | 35 day SMA | 998.24 | 996.65 | 996.65 | | 50 day SMA | 986.15 | 984.76 | 984.32 | | 100 day SMA | 976.47 | 976.09 | 976.08 | | 150 day SMA | | 200 day SMA |
|
|
