10efsl2033 938530 full analysis,charts,indicators,moving averages,SMA,DMA,EMA,ADX,MACD,RSI10efsl2033 938530 WideScreen charts, DMA,SMA,EMA technical analysis, forecast prediction, by indicators ADX,MACD,RSI,CCI BSE stock exchange
Daily price and charts and targets 10efsl2033 Strong Daily Stock price targets for 10efsl2033 938530 are 971.8 and 979.8 | Daily Target 1 | 965.13 | | Daily Target 2 | 970.47 | | Daily Target 3 | 973.13333333333 | | Daily Target 4 | 978.47 | | Daily Target 5 | 981.13 |
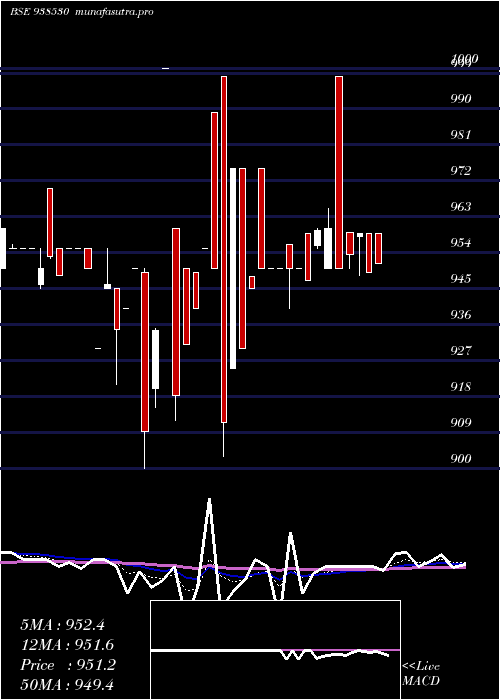
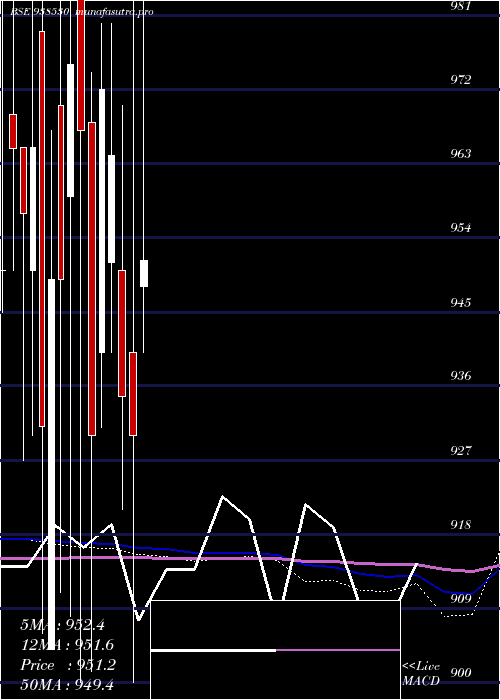
Daily price and volume 10efsl2033
| Date |
Closing |
Open |
Range |
Volume |
Tue 02 September 2025 |
975.80 (0.83%) |
967.80 |
967.80 - 975.80 |
0.7433 times |
Mon 01 September 2025 |
967.80 (0.29%) |
967.80 |
967.80 - 967.80 |
1.31 times |
Fri 29 August 2025 |
964.99 (0.75%) |
964.00 |
955.20 - 964.99 |
2.2667 times |
Thu 28 August 2025 |
957.82 (-0.25%) |
975.80 |
955.80 - 975.80 |
3.0627 times |
Tue 26 August 2025 |
960.20 (-1.01%) |
960.20 |
960.20 - 960.20 |
0.2636 times |
Mon 25 August 2025 |
970.00 (0%) |
970.00 |
970.00 - 970.00 |
0.1054 times |
Thu 21 August 2025 |
970.00 (0.19%) |
970.00 |
970.00 - 970.00 |
0.282 times |
Wed 20 August 2025 |
968.20 (0.78%) |
968.00 |
968.00 - 968.20 |
0.3822 times |
Tue 19 August 2025 |
960.69 (-1.47%) |
975.00 |
955.20 - 975.00 |
0.9726 times |
Mon 18 August 2025 |
975.00 (0%) |
960.00 |
960.00 - 975.00 |
0.6115 times |
Tue 12 August 2025 |
975.00 (1.04%) |
975.00 |
975.00 - 975.00 |
0.7775 times |
Weekly price and charts 10efsl2033 Strong weekly Stock price targets for 10efsl2033 938530 are 971.8 and 979.8 | Weekly Target 1 | 965.13 | | Weekly Target 2 | 970.47 | | Weekly Target 3 | 973.13333333333 | | Weekly Target 4 | 978.47 | | Weekly Target 5 | 981.13 |
Weekly price and volumes for 10efsl2033
| Date |
Closing |
Open |
Range |
Volume |
Tue 02 September 2025 |
975.80 (1.12%) |
967.80 |
967.80 - 975.80 |
0.7612 times |
Fri 29 August 2025 |
964.99 (-0.52%) |
970.00 |
955.20 - 975.80 |
2.1126 times |
Thu 21 August 2025 |
970.00 (-0.51%) |
960.00 |
955.20 - 975.00 |
0.8335 times |
Tue 12 August 2025 |
975.00 (1.91%) |
956.75 |
956.75 - 975.00 |
0.3654 times |
Fri 08 August 2025 |
956.75 (-1.87%) |
975.00 |
956.75 - 975.00 |
0.6928 times |
Thu 31 July 2025 |
975.00 (1.04%) |
967.00 |
955.30 - 975.00 |
0.4524 times |
Fri 25 July 2025 |
965.00 (0.73%) |
971.90 |
962.00 - 981.50 |
1.0739 times |
Fri 18 July 2025 |
958.00 (-1.24%) |
970.00 |
951.20 - 970.00 |
1.3514 times |
Fri 11 July 2025 |
970.00 (0.96%) |
960.50 |
959.99 - 995.00 |
1.3152 times |
Fri 04 July 2025 |
960.79 (0.61%) |
955.00 |
955.00 - 960.80 |
1.0416 times |
Thu 26 June 2025 |
955.01 (0.53%) |
955.00 |
955.00 - 955.01 |
1.8497 times |

Monthly price and charts 10efsl2033 Strong monthly Stock price targets for 10efsl2033 938530 are 971.8 and 979.8 | Monthly Target 1 | 965.13 | | Monthly Target 2 | 970.47 | | Monthly Target 3 | 973.13333333333 | | Monthly Target 4 | 978.47 | | Monthly Target 5 | 981.13 |
Monthly price and volumes 10efsl2033
| Date |
Closing |
Open |
Range |
Volume |
Tue 02 September 2025 |
975.80 (1.12%) |
967.80 |
967.80 - 975.80 |
0.1385 times |
Fri 29 August 2025 |
964.99 (-1.03%) |
975.00 |
955.20 - 975.80 |
0.7286 times |
Thu 31 July 2025 |
975.00 (2.09%) |
955.00 |
951.20 - 995.00 |
0.9524 times |
Thu 26 June 2025 |
955.01 (-1.55%) |
965.00 |
941.20 - 975.00 |
0.9682 times |
Tue 27 May 2025 |
970.00 (4.3%) |
948.00 |
940.00 - 998.00 |
1.0161 times |
Wed 30 April 2025 |
930.00 (-0.5%) |
940.00 |
900.00 - 1000.00 |
0.9531 times |
Fri 28 March 2025 |
934.69 (-3.04%) |
950.00 |
921.01 - 970.00 |
3.0953 times |
Fri 28 February 2025 |
963.97 (-0.83%) |
951.00 |
940.00 - 980.00 |
0.8232 times |
Thu 30 January 2025 |
972.00 (4.52%) |
939.99 |
931.00 - 980.00 |
0.1028 times |
Tue 31 December 2024 |
930.00 (-3.83%) |
968.00 |
901.31 - 974.00 |
1.2218 times |
Fri 29 November 2024 |
967.00 (-0.82%) |
990.00 |
900.00 - 1040.00 |
0.9739 times |
DMA SMA EMA moving averages of 10efsl2033 938530
DMA (daily moving average) of 10efsl2033 938530
| DMA period | DMA value | | 5 day DMA | 965.32 | | 12 day DMA | 967.54 | | 20 day DMA | 969.05 | | 35 day DMA | 968.02 | | 50 day DMA | 964.94 | | 100 day DMA | 957.98 | | 150 day DMA | 955.1 | | 200 day DMA | 953.46 | EMA (exponential moving average) of 10efsl2033 938530
| EMA period | EMA current | EMA prev | EMA prev2 | | 5 day EMA | 968.73 | 965.19 | 963.88 | | 12 day EMA | 967.7 | 966.23 | 965.95 | | 20 day EMA | 967.67 | 966.81 | 966.71 | | 35 day EMA | 966.72 | 966.19 | 966.09 | | 50 day EMA | 965.45 | 965.03 | 964.92 |
SMA (simple moving average) of 10efsl2033 938530
| SMA period | SMA current | SMA prev | SMA prev2 | | 5 day SMA | 965.32 | 964.16 | 964.6 | | 12 day SMA | 967.54 | 965.95 | 966.55 | | 20 day SMA | 969.05 | 968.76 | 968.62 | | 35 day SMA | 968.02 | 967.59 | 967.23 | | 50 day SMA | 964.94 | 964.83 | 964.87 | | 100 day SMA | 957.98 | 957.96 | 957.93 | | 150 day SMA | 955.1 | 954.97 | 954.85 | | 200 day SMA | 953.46 | 953.48 | 953.46 |
|
|
