920efsl2026 938518 full analysis,charts,indicators,moving averages,SMA,DMA,EMA,ADX,MACD,RSI920efsl2026 938518 WideScreen charts, DMA,SMA,EMA technical analysis, forecast prediction, by indicators ADX,MACD,RSI,CCI BSE stock exchange
Daily price and charts and targets 920efsl2026 Strong Daily Stock price targets for 920efsl2026 938518 are 987 and 991 | Daily Target 1 | 986.33 | | Daily Target 2 | 987.67 | | Daily Target 3 | 990.33333333333 | | Daily Target 4 | 991.67 | | Daily Target 5 | 994.33 |
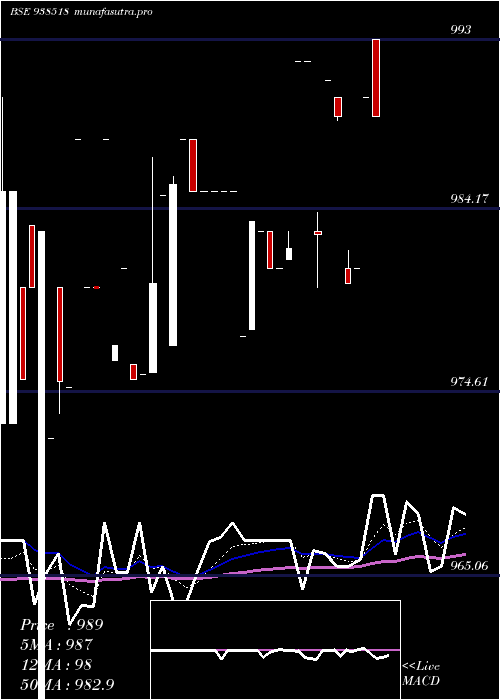
Daily price and volume 920efsl2026
| Date |
Closing |
Open |
Range |
Volume |
Thu 23 October 2025 |
989.00 (-0.1%) |
993.00 |
989.00 - 993.00 |
2.0062 times |
Mon 20 October 2025 |
990.00 (0.92%) |
990.00 |
990.00 - 990.00 |
0.0141 times |
Thu 16 October 2025 |
981.00 (0.08%) |
981.00 |
981.00 - 981.00 |
0.0707 times |
Tue 30 September 2025 |
980.20 (-0.89%) |
981.00 |
980.20 - 982.00 |
0.2094 times |
Wed 24 September 2025 |
989.00 (-0.18%) |
990.00 |
988.80 - 990.00 |
1.4431 times |
Tue 23 September 2025 |
990.80 (0.82%) |
990.80 |
990.80 - 990.80 |
0.283 times |
Mon 22 September 2025 |
982.74 (-0.91%) |
983.00 |
980.00 - 984.01 |
5.3594 times |
Thu 18 September 2025 |
991.80 (0%) |
991.80 |
991.80 - 991.80 |
0.0424 times |
Wed 17 September 2025 |
991.80 (0.99%) |
991.80 |
991.80 - 991.80 |
0.0113 times |
Mon 15 September 2025 |
982.08 (0.11%) |
981.50 |
981.50 - 983.00 |
0.5603 times |
Fri 12 September 2025 |
981.00 (0%) |
981.00 |
981.00 - 981.00 |
0.0283 times |
Weekly price and charts 920efsl2026 Strong weekly Stock price targets for 920efsl2026 938518 are 987 and 991 | Weekly Target 1 | 986.33 | | Weekly Target 2 | 987.67 | | Weekly Target 3 | 990.33333333333 | | Weekly Target 4 | 991.67 | | Weekly Target 5 | 994.33 |
Weekly price and volumes for 920efsl2026
| Date |
Closing |
Open |
Range |
Volume |
Thu 23 October 2025 |
989.00 (0.82%) |
990.00 |
989.00 - 993.00 |
1.0293 times |
Thu 16 October 2025 |
981.00 (-0.81%) |
981.00 |
980.20 - 982.00 |
0.1427 times |
Wed 24 September 2025 |
989.00 (-0.28%) |
983.00 |
980.00 - 990.80 |
3.6096 times |
Thu 18 September 2025 |
991.80 (1.1%) |
981.50 |
981.50 - 991.80 |
0.3128 times |
Fri 12 September 2025 |
981.00 (-0.25%) |
983.00 |
981.00 - 983.00 |
0.0894 times |
Fri 22 August 2025 |
983.50 (-0.15%) |
977.50 |
977.50 - 983.50 |
0.0245 times |
Thu 07 August 2025 |
985.00 (0%) |
985.00 |
985.00 - 985.00 |
0.4426 times |
Wed 30 July 2025 |
985.00 (-0.28%) |
987.80 |
985.00 - 987.80 |
1.4646 times |
Fri 25 July 2025 |
987.80 (1.26%) |
975.58 |
975.58 - 987.80 |
2.7202 times |
Thu 17 July 2025 |
975.50 (-0.15%) |
981.00 |
975.20 - 981.00 |
0.1643 times |
Fri 04 July 2025 |
977.00 (-1.09%) |
980.00 |
976.20 - 987.80 |
0.2652 times |

Monthly price and charts 920efsl2026 Strong monthly Stock price targets for 920efsl2026 938518 are 985 and 997 | Monthly Target 1 | 975.67 | | Monthly Target 2 | 982.33 | | Monthly Target 3 | 987.66666666667 | | Monthly Target 4 | 994.33 | | Monthly Target 5 | 999.67 |
Monthly price and volumes 920efsl2026
| Date |
Closing |
Open |
Range |
Volume |
Thu 23 October 2025 |
989.00 (0.9%) |
981.00 |
981.00 - 993.00 |
0.3438 times |
Tue 30 September 2025 |
980.20 (-0.34%) |
983.00 |
980.00 - 991.80 |
1.3291 times |
Fri 22 August 2025 |
983.50 (-0.15%) |
985.00 |
977.50 - 985.00 |
0.1507 times |
Wed 30 July 2025 |
985.00 (0.51%) |
980.05 |
975.20 - 987.80 |
1.4877 times |
Mon 30 June 2025 |
980.00 (-0.64%) |
968.70 |
955.50 - 990.00 |
0.4429 times |
Tue 27 May 2025 |
986.32 (0.79%) |
990.00 |
970.00 - 1005.00 |
1.4459 times |
Wed 30 April 2025 |
978.60 (0.78%) |
972.00 |
965.00 - 989.00 |
0.8695 times |
Fri 28 March 2025 |
971.03 (-0.41%) |
975.00 |
960.00 - 989.00 |
2.9503 times |
Fri 28 February 2025 |
975.00 (0.83%) |
960.00 |
954.20 - 988.00 |
0.3075 times |
Wed 22 January 2025 |
967.00 (0.12%) |
952.80 |
945.65 - 969.80 |
0.6727 times |
Tue 31 December 2024 |
965.80 (1.13%) |
953.80 |
950.00 - 979.66 |
2.252 times |

DMA SMA EMA moving averages of 920efsl2026 938518
DMA (daily moving average) of 920efsl2026 938518
| DMA period | DMA value | | 5 day DMA | 985.84 | | 12 day DMA | 985.87 | | 20 day DMA | 984.97 | | 35 day DMA | 982.97 | | 50 day DMA | 983.78 | | 100 day DMA | 977.61 | | 150 day DMA | 972.13 | | 200 day DMA | 967.3 | EMA (exponential moving average) of 920efsl2026 938518
| EMA period | EMA current | EMA prev | EMA prev2 | | 5 day EMA | 986.97 | 985.95 | 983.93 | | 12 day EMA | 985.96 | 985.41 | 984.57 | | 20 day EMA | 985.3 | 984.91 | 984.37 | | 35 day EMA | 985.14 | 984.91 | 984.61 | | 50 day EMA | 984.86 | 984.69 | 984.47 |
SMA (simple moving average) of 920efsl2026 938518
| SMA period | SMA current | SMA prev | SMA prev2 | | 5 day SMA | 985.84 | 986.2 | 984.75 | | 12 day SMA | 985.87 | 985.37 | 984.83 | | 20 day SMA | 984.97 | 984.91 | 984.68 | | 35 day SMA | 982.97 | 982.8 | 982.52 | | 50 day SMA | 983.78 | 984.08 | 984.16 | | 100 day SMA | 977.61 | 977.34 | 976.96 | | 150 day SMA | 972.13 | 971.87 | 971.67 | | 200 day SMA | 967.3 | 967.11 | 966.9 |
|
|
