10efsl33 938370 full analysis,charts,indicators,moving averages,SMA,DMA,EMA,ADX,MACD,RSI10efsl33 938370 WideScreen charts, DMA,SMA,EMA technical analysis, forecast prediction, by indicators ADX,MACD,RSI,CCI BSE stock exchange
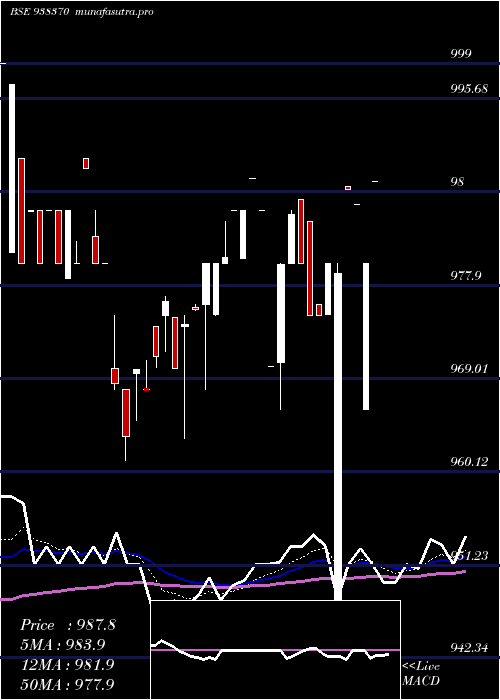
Daily price and charts and targets 10efsl33 Strong Daily Stock price targets for 10efsl33 938370 are 987.8 and 987.8 | Daily Target 1 | 987.8 | | Daily Target 2 | 987.8 | | Daily Target 3 | 987.8 | | Daily Target 4 | 987.8 | | Daily Target 5 | 987.8 |
Daily price and volume 10efsl33
| Date |
Closing |
Open |
Range |
Volume |
Fri 05 December 2025 |
987.80 (0.8%) |
987.80 |
987.80 - 987.80 |
0.1334 times |
Thu 04 December 2025 |
980.00 (-0.57%) |
966.00 |
966.00 - 980.00 |
0.0867 times |
Wed 03 December 2025 |
985.59 (-0.14%) |
985.59 |
985.59 - 985.59 |
0.0667 times |
Tue 02 December 2025 |
986.99 (0.82%) |
987.30 |
986.99 - 987.30 |
0.1935 times |
Mon 01 December 2025 |
978.98 (-0.1%) |
889.00 |
889.00 - 980.00 |
4.1027 times |
Fri 28 November 2025 |
980.00 (0.51%) |
975.01 |
975.01 - 980.00 |
0.6004 times |
Thu 27 November 2025 |
975.00 (0%) |
976.00 |
975.00 - 976.00 |
0.527 times |
Wed 26 November 2025 |
975.00 (-0.51%) |
984.00 |
975.00 - 984.00 |
0.6738 times |
Tue 25 November 2025 |
980.00 (-0.47%) |
986.00 |
980.00 - 986.00 |
1.3409 times |
Mon 24 November 2025 |
984.60 (0.48%) |
980.00 |
980.00 - 985.00 |
2.2748 times |
Fri 21 November 2025 |
979.90 (1%) |
970.50 |
966.00 - 980.00 |
41.1875 times |
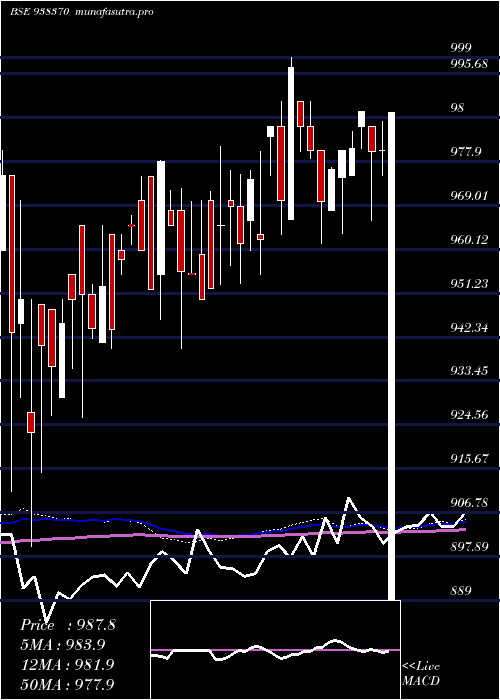
Weekly price and charts 10efsl33 Strong weekly Stock price targets for 10efsl33 938370 are 938.4 and 1037.2 | Weekly Target 1 | 856.07 | | Weekly Target 2 | 921.93 | | Weekly Target 3 | 954.86666666667 | | Weekly Target 4 | 1020.73 | | Weekly Target 5 | 1053.67 |
Weekly price and volumes for 10efsl33
| Date |
Closing |
Open |
Range |
Volume |
Fri 05 December 2025 |
987.80 (0.8%) |
889.00 |
889.00 - 987.80 |
0.4128 times |
Fri 28 November 2025 |
980.00 (0.01%) |
980.00 |
975.00 - 986.00 |
0.4879 times |
Fri 21 November 2025 |
979.90 (-0.82%) |
985.00 |
966.00 - 985.00 |
3.8098 times |
Thu 13 November 2025 |
988.00 (0.76%) |
985.00 |
980.50 - 988.00 |
0.14 times |
Fri 07 November 2025 |
980.58 (0.06%) |
975.01 |
975.00 - 984.00 |
0.1244 times |
Thu 30 October 2025 |
980.00 (0.38%) |
974.74 |
963.30 - 980.00 |
1.5549 times |
Thu 23 October 2025 |
976.32 (0.66%) |
968.01 |
968.00 - 976.80 |
0.721 times |
Fri 17 October 2025 |
969.90 (-1.03%) |
980.00 |
961.25 - 980.00 |
1.8115 times |
Fri 10 October 2025 |
980.00 (-0.51%) |
984.99 |
978.50 - 990.00 |
0.587 times |
Fri 03 October 2025 |
984.99 (-1.2%) |
990.00 |
979.99 - 990.00 |
0.3509 times |
Fri 26 September 2025 |
997.00 (2.78%) |
966.15 |
966.15 - 999.00 |
0.2565 times |
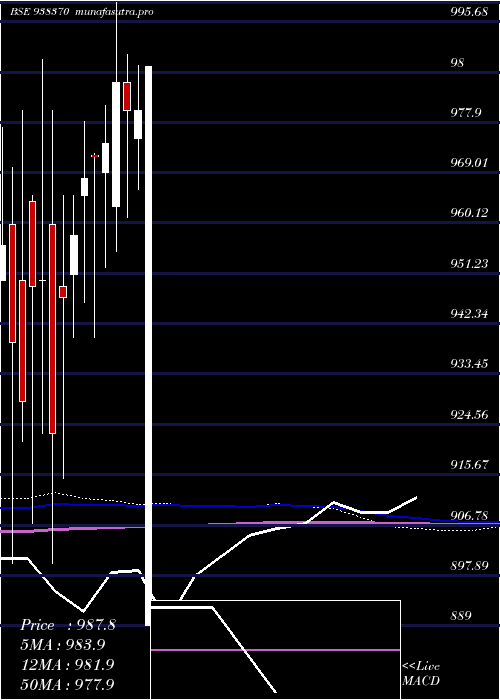
Monthly price and charts 10efsl33 Strong monthly Stock price targets for 10efsl33 938370 are 938.4 and 1037.2 | Monthly Target 1 | 856.07 | | Monthly Target 2 | 921.93 | | Monthly Target 3 | 954.86666666667 | | Monthly Target 4 | 1020.73 | | Monthly Target 5 | 1053.67 |
Monthly price and volumes 10efsl33
| Date |
Closing |
Open |
Range |
Volume |
Fri 05 December 2025 |
987.80 (0.8%) |
889.00 |
889.00 - 987.80 |
0.1485 times |
Fri 28 November 2025 |
980.00 (0%) |
975.01 |
966.00 - 988.00 |
1.6417 times |
Thu 30 October 2025 |
980.00 (-0.51%) |
984.99 |
961.25 - 990.00 |
1.7059 times |
Tue 30 September 2025 |
985.00 (1.11%) |
963.00 |
955.10 - 999.00 |
1.2771 times |
Fri 29 August 2025 |
974.15 (0.23%) |
969.00 |
952.20 - 981.00 |
0.921 times |
Wed 30 July 2025 |
971.90 (0.4%) |
972.00 |
940.00 - 972.50 |
0.9353 times |
Mon 30 June 2025 |
968.00 (1.04%) |
965.00 |
946.00 - 978.00 |
0.7675 times |
Thu 29 May 2025 |
958.00 (1.16%) |
951.00 |
940.00 - 964.99 |
0.8514 times |
Wed 30 April 2025 |
947.00 (2.61%) |
949.00 |
915.00 - 965.00 |
1.0804 times |
Tue 25 March 2025 |
922.95 (-2.85%) |
960.00 |
900.00 - 980.00 |
0.6711 times |
Fri 28 February 2025 |
950.02 (0.11%) |
950.00 |
923.01 - 989.00 |
0.478 times |
DMA SMA EMA moving averages of 10efsl33 938370
DMA (daily moving average) of 10efsl33 938370
| DMA period | DMA value | | 5 day DMA | 983.87 | | 12 day DMA | 980.34 | | 20 day DMA | 981.16 | | 35 day DMA | 978.96 | | 50 day DMA | 980.03 | | 100 day DMA | 972.28 | | 150 day DMA | 964.42 | | 200 day DMA | 960.38 | EMA (exponential moving average) of 10efsl33 938370
| EMA period | EMA current | EMA prev | EMA prev2 | | 5 day EMA | 983.85 | 981.87 | 982.8 | | 12 day EMA | 981.93 | 980.86 | 981.02 | | 20 day EMA | 980.91 | 980.18 | 980.2 | | 35 day EMA | 980.56 | 980.13 | 980.14 | | 50 day EMA | 979.98 | 979.66 | 979.65 |
SMA (simple moving average) of 10efsl33 938370
| SMA period | SMA current | SMA prev | SMA prev2 | | 5 day SMA | 983.87 | 982.31 | 981.31 | | 12 day SMA | 980.34 | 980.11 | 980.77 | | 20 day SMA | 981.16 | 980.48 | 979.98 | | 35 day SMA | 978.96 | 978.74 | 978.88 | | 50 day SMA | 980.03 | 979.87 | 979.86 | | 100 day SMA | 972.28 | 971.98 | 971.78 | | 150 day SMA | 964.42 | 964.16 | 963.96 | | 200 day SMA | 960.38 | 960.19 | 960.13 |
|
|
