920efsl26 938358 full analysis,charts,indicators,moving averages,SMA,DMA,EMA,ADX,MACD,RSI920efsl26 938358 WideScreen charts, DMA,SMA,EMA technical analysis, forecast prediction, by indicators ADX,MACD,RSI,CCI BSE stock exchange
Daily price and charts and targets 920efsl26 Strong Daily Stock price targets for 920efsl26 938358 are 999 and 999 | Daily Target 1 | 999 | | Daily Target 2 | 999 | | Daily Target 3 | 999 | | Daily Target 4 | 999 | | Daily Target 5 | 999 |
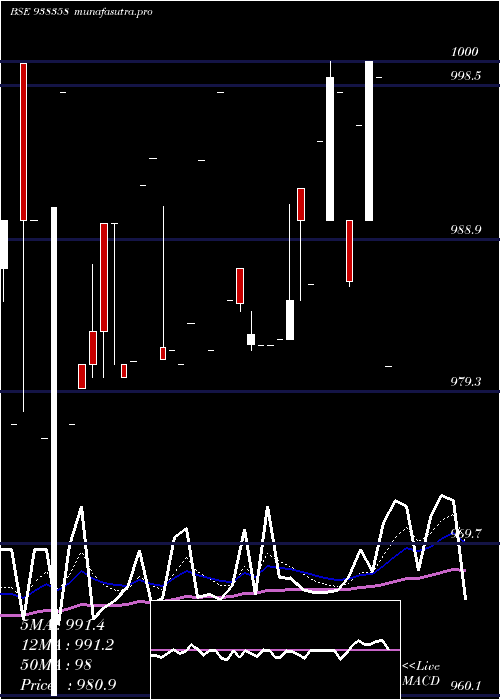
Daily price and volume 920efsl26
| Date |
Closing |
Open |
Range |
Volume |
Tue 21 October 2025 |
999.00 (0%) |
999.00 |
999.00 - 999.00 |
0.0489 times |
Mon 20 October 2025 |
999.00 (0.3%) |
996.00 |
996.00 - 999.00 |
2.0029 times |
Thu 16 October 2025 |
996.00 (0.1%) |
996.00 |
996.00 - 1002.85 |
1.0259 times |
Wed 15 October 2025 |
995.00 (0%) |
998.00 |
995.00 - 998.00 |
0.4885 times |
Tue 14 October 2025 |
995.00 (0.51%) |
990.00 |
990.00 - 995.00 |
0.0733 times |
Thu 09 October 2025 |
990.00 (-0.5%) |
990.00 |
990.00 - 990.00 |
0.0342 times |
Mon 06 October 2025 |
995.00 (-0.1%) |
995.00 |
995.00 - 995.00 |
1.9541 times |
Fri 03 October 2025 |
996.00 (0.1%) |
996.00 |
996.00 - 996.00 |
1.1724 times |
Tue 30 September 2025 |
995.00 (0.51%) |
995.00 |
995.00 - 995.00 |
0.7328 times |
Fri 26 September 2025 |
990.00 (-0.6%) |
988.50 |
988.50 - 990.00 |
2.467 times |
Thu 25 September 2025 |
996.00 (0.2%) |
987.55 |
987.55 - 996.00 |
0.8451 times |
Weekly price and charts 920efsl26 Strong weekly Stock price targets for 920efsl26 938358 are 997.5 and 1000.5 | Weekly Target 1 | 995 | | Weekly Target 2 | 997 | | Weekly Target 3 | 998 | | Weekly Target 4 | 1000 | | Weekly Target 5 | 1001 |
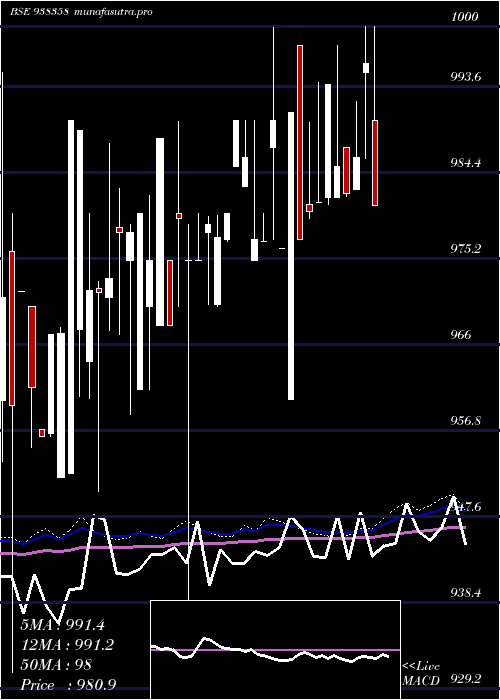
Weekly price and volumes for 920efsl26
| Date |
Closing |
Open |
Range |
Volume |
Tue 21 October 2025 |
999.00 (0.3%) |
996.00 |
996.00 - 999.00 |
0.0642 times |
Thu 16 October 2025 |
996.00 (0.61%) |
990.00 |
990.00 - 1002.85 |
0.0497 times |
Thu 09 October 2025 |
990.00 (-0.6%) |
995.00 |
990.00 - 995.00 |
0.0623 times |
Fri 03 October 2025 |
996.00 (0.61%) |
995.00 |
995.00 - 996.00 |
0.0597 times |
Fri 26 September 2025 |
990.00 (0.39%) |
961.54 |
961.54 - 996.00 |
0.1952 times |
Fri 19 September 2025 |
986.20 (-0.38%) |
990.00 |
986.20 - 990.00 |
0.0851 times |
Thu 11 September 2025 |
990.00 (-0.4%) |
982.50 |
982.50 - 995.00 |
0.0612 times |
Thu 28 August 2025 |
994.00 (-0.1%) |
995.00 |
994.00 - 995.00 |
9.2631 times |
Fri 22 August 2025 |
995.00 (-0.3%) |
985.00 |
985.00 - 996.00 |
0.0762 times |
Wed 13 August 2025 |
998.00 (0.6%) |
992.00 |
990.00 - 1000.00 |
0.0834 times |
Thu 07 August 2025 |
992.00 (-0.08%) |
998.00 |
990.01 - 998.00 |
0.1187 times |
Monthly price and charts 920efsl26 Strong monthly Stock price targets for 920efsl26 938358 are 994.5 and 1007.35 | Monthly Target 1 | 984.43 | | Monthly Target 2 | 991.72 | | Monthly Target 3 | 997.28333333333 | | Monthly Target 4 | 1004.57 | | Monthly Target 5 | 1010.13 |
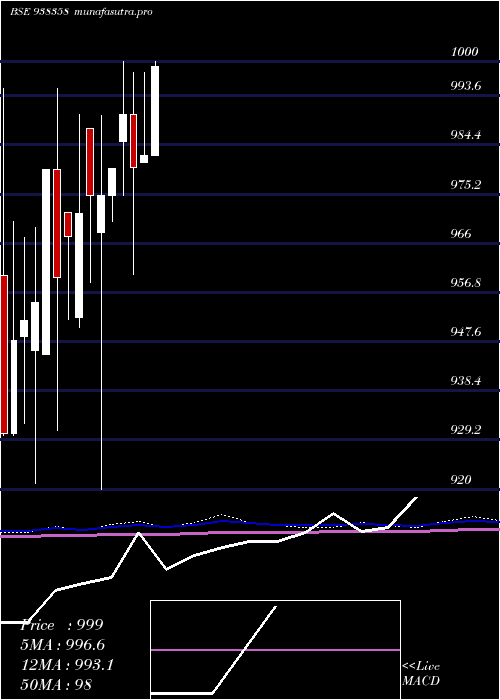
Monthly price and volumes 920efsl26
| Date |
Closing |
Open |
Range |
Volume |
Tue 21 October 2025 |
999.00 (0.4%) |
996.00 |
990.00 - 1002.85 |
0.1592 times |
Tue 30 September 2025 |
995.00 (0.1%) |
982.50 |
961.54 - 996.00 |
0.2724 times |
Thu 28 August 2025 |
994.00 (0.12%) |
992.80 |
985.00 - 1000.00 |
7.42 times |
Tue 29 July 2025 |
992.80 (1.05%) |
982.50 |
980.90 - 1000.00 |
0.3677 times |
Mon 30 June 2025 |
982.50 (0.23%) |
981.18 |
981.00 - 998.00 |
0.1608 times |
Fri 30 May 2025 |
980.20 (-0.99%) |
990.00 |
960.10 - 998.00 |
0.0739 times |
Wed 30 April 2025 |
990.00 (1.02%) |
985.00 |
975.00 - 999.90 |
0.1378 times |
Wed 26 March 2025 |
980.00 (0.51%) |
975.00 |
970.00 - 980.00 |
0.2418 times |
Fri 28 February 2025 |
975.00 (0%) |
968.00 |
920.00 - 989.90 |
0.4316 times |
Fri 31 January 2025 |
975.00 (0.36%) |
987.50 |
958.55 - 987.50 |
0.7348 times |
Mon 30 December 2024 |
971.50 (0.44%) |
952.20 |
950.30 - 989.99 |
0.1996 times |
DMA SMA EMA moving averages of 920efsl26 938358
DMA (daily moving average) of 920efsl26 938358
| DMA period | DMA value | | 5 day DMA | 996.8 | | 12 day DMA | 995 | | 20 day DMA | 992.63 | | 35 day DMA | 992.99 | | 50 day DMA | 992.67 | | 100 day DMA | 988.21 | | 150 day DMA | 983.93 | | 200 day DMA | 979.88 | EMA (exponential moving average) of 920efsl26 938358
| EMA period | EMA current | EMA prev | EMA prev2 | | 5 day EMA | 997.09 | 996.13 | 994.69 | | 12 day EMA | 995.13 | 994.43 | 993.6 | | 20 day EMA | 994.1 | 993.58 | 993.01 | | 35 day EMA | 993.07 | 992.72 | 992.35 | | 50 day EMA | 992.7 | 992.44 | 992.17 |
SMA (simple moving average) of 920efsl26 938358
| SMA period | SMA current | SMA prev | SMA prev2 | | 5 day SMA | 996.8 | 995 | 994.2 | | 12 day SMA | 995 | 993.93 | 993.59 | | 20 day SMA | 992.63 | 992.38 | 992.18 | | 35 day SMA | 992.99 | 992.69 | 992.62 | | 50 day SMA | 992.67 | 992.59 | 992.33 | | 100 day SMA | 988.21 | 988 | 987.79 | | 150 day SMA | 983.93 | 983.71 | 983.58 | | 200 day SMA | 979.88 | 979.66 | 979.44 |
|
|
