0efsl26 937343 full analysis,charts,indicators,moving averages,SMA,DMA,EMA,ADX,MACD,RSI0efsl26 937343 WideScreen charts, DMA,SMA,EMA technical analysis, forecast prediction, by indicators ADX,MACD,RSI,CCI BSE stock exchange
Daily price and charts and targets 0efsl26 Strong Daily Stock price targets for 0efsl26 937343 are 1512.95 and 1512.95 | Daily Target 1 | 1512.95 | | Daily Target 2 | 1512.95 | | Daily Target 3 | 1512.95 | | Daily Target 4 | 1512.95 | | Daily Target 5 | 1512.95 |
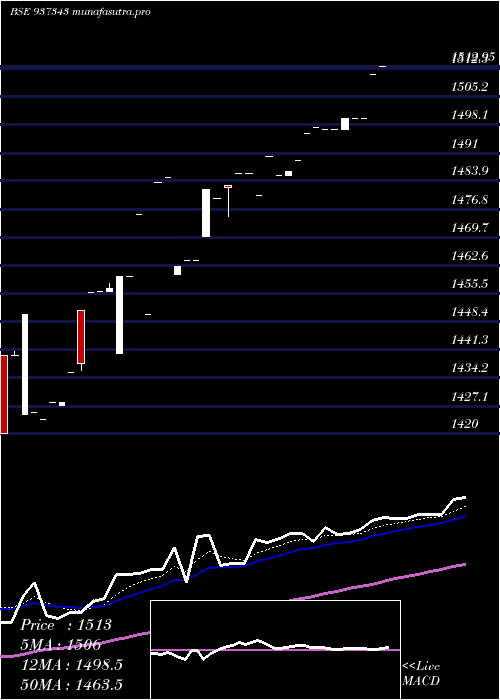
Daily price and volume 0efsl26
| Date |
Closing |
Open |
Range |
Volume |
Fri 11 July 2025 |
1512.95 (0.13%) |
1512.95 |
1512.95 - 1512.95 |
0.0652 times |
Thu 10 July 2025 |
1510.95 (0.74%) |
1510.95 |
1510.95 - 1510.95 |
0.6522 times |
Fri 04 July 2025 |
1499.80 (0%) |
1499.80 |
1499.80 - 1499.80 |
0.7391 times |
Thu 03 July 2025 |
1499.80 (0%) |
1499.80 |
1499.80 - 1499.80 |
0.2391 times |
Wed 02 July 2025 |
1499.80 (0.19%) |
1496.99 |
1496.99 - 1499.80 |
7.4783 times |
Tue 01 July 2025 |
1496.99 (0%) |
1496.99 |
1496.99 - 1496.99 |
0.2391 times |
Mon 30 June 2025 |
1496.99 (-0.03%) |
1496.99 |
1496.99 - 1496.99 |
0.0217 times |
Fri 27 June 2025 |
1497.50 (0.1%) |
1497.50 |
1497.50 - 1497.50 |
0.4348 times |
Tue 24 June 2025 |
1496.00 (0.47%) |
1496.00 |
1496.00 - 1496.00 |
0.0217 times |
Thu 19 June 2025 |
1489.00 (0.19%) |
1489.00 |
1489.00 - 1489.00 |
0.1087 times |
Tue 17 June 2025 |
1486.20 (0.07%) |
1485.20 |
1485.20 - 1486.20 |
2.5652 times |
Weekly price and charts 0efsl26 Strong weekly Stock price targets for 0efsl26 937343 are 1511.95 and 1513.95 | Weekly Target 1 | 1510.28 | | Weekly Target 2 | 1511.62 | | Weekly Target 3 | 1512.2833333333 | | Weekly Target 4 | 1513.62 | | Weekly Target 5 | 1514.28 |
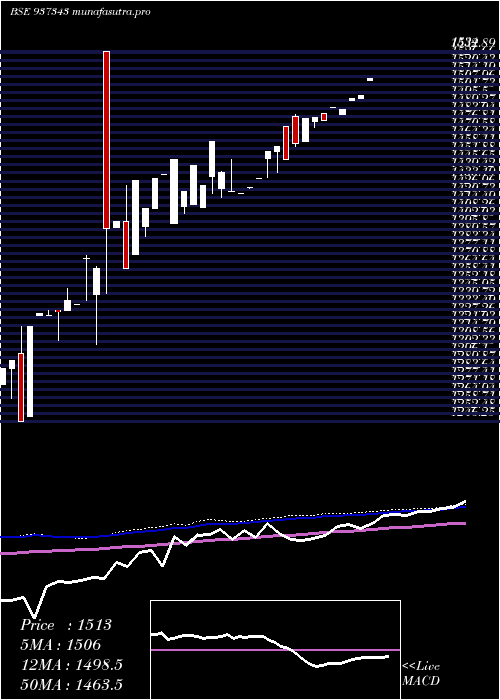
Weekly price and volumes for 0efsl26
| Date |
Closing |
Open |
Range |
Volume |
Fri 11 July 2025 |
1512.95 (0.88%) |
1510.95 |
1510.95 - 1512.95 |
0.1331 times |
Fri 04 July 2025 |
1499.80 (0.15%) |
1496.99 |
1496.99 - 1499.80 |
1.6169 times |
Fri 27 June 2025 |
1497.50 (0.57%) |
1496.00 |
1496.00 - 1497.50 |
0.0847 times |
Thu 19 June 2025 |
1489.00 (-0.08%) |
1485.20 |
1485.20 - 1489.00 |
0.5 times |
Wed 11 June 2025 |
1490.20 (0.68%) |
1490.20 |
1490.20 - 1490.20 |
0.3629 times |
Fri 06 June 2025 |
1480.20 (-0.14%) |
1485.70 |
1480.20 - 1485.70 |
1.2419 times |
Fri 30 May 2025 |
1482.31 (0.04%) |
1479.50 |
1475.00 - 1482.80 |
1.3548 times |
Thu 22 May 2025 |
1481.70 (1.33%) |
1463.81 |
1463.81 - 1481.70 |
2.2137 times |
Thu 15 May 2025 |
1462.20 (0.83%) |
1483.54 |
1460.21 - 1484.85 |
2.4032 times |
Fri 09 May 2025 |
1450.21 (-0.66%) |
1475.45 |
1450.21 - 1475.45 |
0.0887 times |
Fri 02 May 2025 |
1459.80 (0.26%) |
1456.00 |
1440.21 - 1459.80 |
0.7056 times |
Monthly price and charts 0efsl26 Strong monthly Stock price targets for 0efsl26 937343 are 1504.97 and 1520.93 | Monthly Target 1 | 1491.67 | | Monthly Target 2 | 1502.31 | | Monthly Target 3 | 1507.63 | | Monthly Target 4 | 1518.27 | | Monthly Target 5 | 1523.59 |
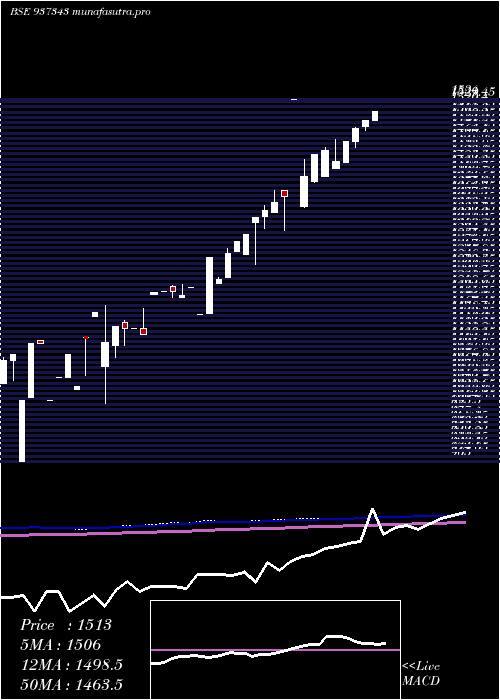
Monthly price and volumes 0efsl26
| Date |
Closing |
Open |
Range |
Volume |
Fri 11 July 2025 |
1512.95 (1.07%) |
1496.99 |
1496.99 - 1512.95 |
0.323 times |
Mon 30 June 2025 |
1496.99 (0.99%) |
1485.70 |
1480.20 - 1497.50 |
0.4058 times |
Fri 30 May 2025 |
1482.31 (1.54%) |
1459.80 |
1450.21 - 1484.85 |
1.1353 times |
Wed 30 April 2025 |
1459.80 (2.41%) |
1423.55 |
1423.55 - 1459.80 |
0.411 times |
Fri 28 March 2025 |
1425.40 (-1.39%) |
1412.99 |
1412.99 - 1463.58 |
1.2599 times |
Fri 21 February 2025 |
1445.55 (0.49%) |
1400.20 |
1400.00 - 1449.96 |
2.7525 times |
Tue 21 January 2025 |
1438.55 (2.75%) |
1391.00 |
1390.00 - 1438.55 |
1.013 times |
Tue 31 December 2024 |
1400.00 (-8.74%) |
1347.70 |
1345.80 - 1429.95 |
1.6038 times |
Wed 06 November 2024 |
1534.00 (12.36%) |
1534.00 |
1534.00 - 1534.00 |
0.1701 times |
Thu 24 October 2024 |
1365.22 (0.81%) |
1375.00 |
1306.00 - 1375.00 |
0.9257 times |
Mon 23 September 2024 |
1354.30 (1.01%) |
1337.00 |
1337.00 - 1375.00 |
0.4834 times |
DMA SMA EMA moving averages of 0efsl26 937343
DMA (daily moving average) of 0efsl26 937343
| DMA period | DMA value | | 5 day DMA | 1504.66 | | 12 day DMA | 1497.6 | | 20 day DMA | 1491.02 | | 35 day DMA | 1475.93 | | 50 day DMA | 1462.82 | | 100 day DMA | 1423.22 | | 150 day DMA | 1349.08 | | 200 day DMA | 1277.23 | EMA (exponential moving average) of 0efsl26 937343
| EMA period | EMA current | EMA prev | EMA prev2 | | 5 day EMA | 1506.01 | 1502.54 | 1498.34 | | 12 day EMA | 1498.51 | 1495.89 | 1493.15 | | 20 day EMA | 1490.99 | 1488.68 | 1486.34 | | 35 day EMA | 1477.21 | 1475.11 | 1473 | | 50 day EMA | 1463.44 | 1461.42 | 1459.4 |
SMA (simple moving average) of 0efsl26 937343
| SMA period | SMA current | SMA prev | SMA prev2 | | 5 day SMA | 1504.66 | 1501.47 | 1498.68 | | 12 day SMA | 1497.6 | 1495.7 | 1493.14 | | 20 day SMA | 1491.02 | 1488.56 | 1486.12 | | 35 day SMA | 1475.93 | 1473.37 | 1470.93 | | 50 day SMA | 1462.82 | 1460.79 | 1458.73 | | 100 day SMA | 1423.22 | 1421.29 | 1418.64 | | 150 day SMA | 1349.08 | 1346.75 | 1344.42 | | 200 day SMA | 1277.23 | 1274.62 | 1271.19 |
|
|
