939efsl26 937339 full analysis,charts,indicators,moving averages,SMA,DMA,EMA,ADX,MACD,RSI939efsl26 937339 WideScreen charts, DMA,SMA,EMA technical analysis, forecast prediction, by indicators ADX,MACD,RSI,CCI BSE stock exchange
Daily price and charts and targets 939efsl26 Strong Daily Stock price targets for 939efsl26 937339 are 1003.14 and 1003.24 | Daily Target 1 | 1003.11 | | Daily Target 2 | 1003.16 | | Daily Target 3 | 1003.2066666667 | | Daily Target 4 | 1003.26 | | Daily Target 5 | 1003.31 |
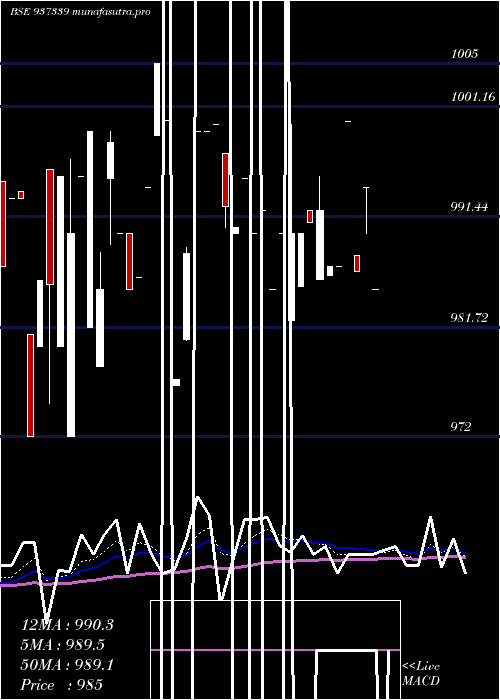
Daily price and volume 939efsl26
| Date |
Closing |
Open |
Range |
Volume |
Mon 20 October 2025 |
1003.22 (0.37%) |
1003.25 |
1003.15 - 1003.25 |
1.7504 times |
Fri 17 October 2025 |
999.55 (-0.04%) |
999.90 |
997.00 - 999.90 |
5.0026 times |
Thu 16 October 2025 |
999.90 (0.49%) |
999.90 |
999.90 - 999.90 |
0.3625 times |
Wed 15 October 2025 |
995.00 (-0.85%) |
995.00 |
995.00 - 995.00 |
1.0357 times |
Mon 13 October 2025 |
1003.55 (0.46%) |
1003.55 |
1003.55 - 1003.55 |
0.0259 times |
Wed 08 October 2025 |
999.00 (0%) |
1000.00 |
999.00 - 1000.00 |
1.1134 times |
Mon 06 October 2025 |
999.00 (-0.1%) |
1003.55 |
999.00 - 1003.55 |
0.0311 times |
Wed 01 October 2025 |
1000.00 (0.7%) |
1003.55 |
1000.00 - 1003.55 |
0.6214 times |
Tue 30 September 2025 |
993.00 (0%) |
993.00 |
993.00 - 993.00 |
0.0052 times |
Fri 26 September 2025 |
993.00 (0.11%) |
993.00 |
993.00 - 993.00 |
0.0518 times |
Mon 22 September 2025 |
991.88 (-0.31%) |
995.00 |
986.00 - 995.00 |
0.8234 times |
Weekly price and charts 939efsl26 Strong weekly Stock price targets for 939efsl26 937339 are 1003.14 and 1003.24 | Weekly Target 1 | 1003.11 | | Weekly Target 2 | 1003.16 | | Weekly Target 3 | 1003.2066666667 | | Weekly Target 4 | 1003.26 | | Weekly Target 5 | 1003.31 |
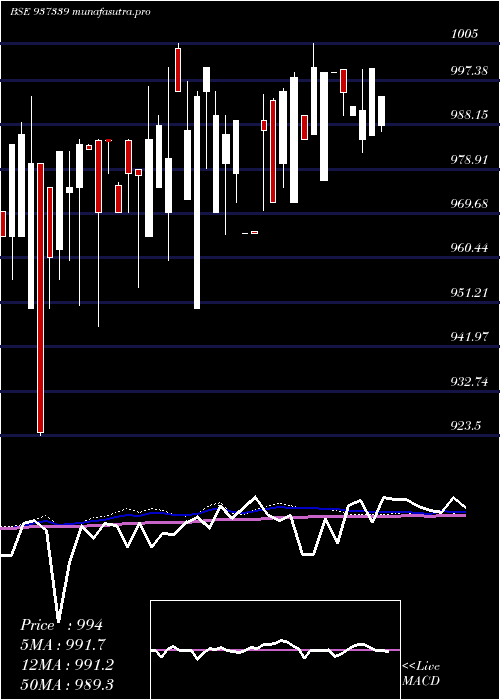
Weekly price and volumes for 939efsl26
| Date |
Closing |
Open |
Range |
Volume |
Mon 20 October 2025 |
1003.22 (0.37%) |
1003.25 |
1003.15 - 1003.25 |
0.9481 times |
Fri 17 October 2025 |
999.55 (0.06%) |
1003.55 |
995.00 - 1003.55 |
3.4811 times |
Wed 08 October 2025 |
999.00 (-0.1%) |
1003.55 |
999.00 - 1003.55 |
0.6199 times |
Wed 01 October 2025 |
1000.00 (0.7%) |
993.00 |
993.00 - 1003.55 |
0.3394 times |
Fri 26 September 2025 |
993.00 (-0.2%) |
995.00 |
986.00 - 995.00 |
0.4741 times |
Fri 19 September 2025 |
995.00 (0.87%) |
1001.00 |
986.90 - 1001.00 |
0.8163 times |
Fri 12 September 2025 |
986.37 (0.13%) |
1000.00 |
985.91 - 1000.00 |
0.9257 times |
Fri 29 August 2025 |
985.10 (-1.49%) |
1000.00 |
985.05 - 1000.00 |
1.1164 times |
Fri 22 August 2025 |
1000.00 (0%) |
1000.00 |
1000.00 - 1000.00 |
0.2132 times |
Thu 14 August 2025 |
1000.00 (0.5%) |
995.00 |
995.00 - 1060.00 |
1.0659 times |
Thu 07 August 2025 |
995.00 (1.22%) |
988.00 |
988.00 - 995.00 |
0.2525 times |
Monthly price and charts 939efsl26 Strong monthly Stock price targets for 939efsl26 937339 are 994.84 and 1003.39 | Monthly Target 1 | 992.04 | | Monthly Target 2 | 997.63 | | Monthly Target 3 | 1000.59 | | Monthly Target 4 | 1006.18 | | Monthly Target 5 | 1009.14 |
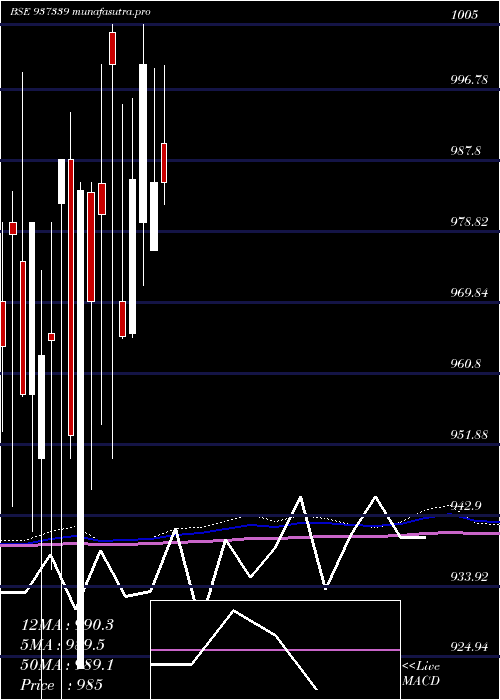
Monthly price and volumes 939efsl26
| Date |
Closing |
Open |
Range |
Volume |
Mon 20 October 2025 |
1003.22 (1.03%) |
1003.55 |
995.00 - 1003.55 |
0.5681 times |
Tue 30 September 2025 |
993.00 (0.8%) |
1000.00 |
985.91 - 1001.00 |
0.234 times |
Fri 29 August 2025 |
985.10 (-1.49%) |
983.05 |
983.05 - 1060.00 |
0.2941 times |
Thu 31 July 2025 |
1000.00 (1.52%) |
990.00 |
982.05 - 1000.00 |
1.0956 times |
Mon 30 June 2025 |
985.00 (-1.5%) |
976.50 |
976.50 - 999.55 |
1.161 times |
Fri 30 May 2025 |
1000.00 (1.48%) |
980.00 |
972.00 - 1005.00 |
1.7024 times |
Wed 30 April 2025 |
985.46 (2.06%) |
966.00 |
965.45 - 995.65 |
1.0314 times |
Fri 28 March 2025 |
965.57 (-3.44%) |
970.00 |
965.25 - 995.00 |
1.242 times |
Fri 28 February 2025 |
1000.00 (1.94%) |
1004.00 |
950.00 - 1005.00 |
0.679 times |
Fri 31 January 2025 |
981.00 (1.13%) |
984.90 |
954.38 - 1000.00 |
1.9924 times |
Thu 26 December 2024 |
970.00 (-1.42%) |
983.75 |
946.12 - 985.00 |
1.2347 times |
DMA SMA EMA moving averages of 939efsl26 937339
DMA (daily moving average) of 939efsl26 937339
| DMA period | DMA value | | 5 day DMA | 1000.24 | | 12 day DMA | 997.68 | | 20 day DMA | 995.97 | | 35 day DMA | 994.68 | | 50 day DMA | 993.44 | | 100 day DMA | 990.88 | | 150 day DMA | 985.76 | | 200 day DMA | 980.63 | EMA (exponential moving average) of 939efsl26 937339
| EMA period | EMA current | EMA prev | EMA prev2 | | 5 day EMA | 1000.38 | 998.96 | 998.67 | | 12 day EMA | 998.53 | 997.68 | 997.34 | | 20 day EMA | 997.19 | 996.56 | 996.24 | | 35 day EMA | 995.38 | 994.92 | 994.65 | | 50 day EMA | 994.04 | 993.67 | 993.43 |
SMA (simple moving average) of 939efsl26 937339
| SMA period | SMA current | SMA prev | SMA prev2 | | 5 day SMA | 1000.24 | 999.4 | 999.29 | | 12 day SMA | 997.68 | 997.49 | 997.61 | | 20 day SMA | 995.97 | 995.43 | 995.45 | | 35 day SMA | 994.68 | 994.21 | 994.22 | | 50 day SMA | 993.44 | 993.37 | 993.36 | | 100 day SMA | 990.88 | 990.65 | 990.66 | | 150 day SMA | 985.76 | 985.66 | 985.43 | | 200 day SMA | 980.63 | 980.41 | 980.22 |
|
|
