0mhil26 936656 full analysis,charts,indicators,moving averages,SMA,DMA,EMA,ADX,MACD,RSI0mhil26 936656 WideScreen charts, DMA,SMA,EMA technical analysis, forecast prediction, by indicators ADX,MACD,RSI,CCI BSE stock exchange
Daily price and charts and targets 0mhil26 Strong Daily Stock price targets for 0mhil26 936656 are 1690.2 and 1697.9 | Daily Target 1 | 1688.33 | | Daily Target 2 | 1692.06 | | Daily Target 3 | 1696.03 | | Daily Target 4 | 1699.76 | | Daily Target 5 | 1703.73 |
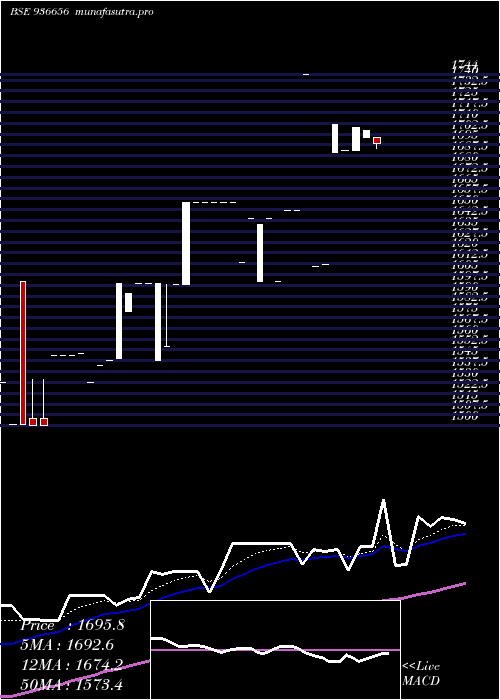
Daily price and volume 0mhil26
| Date |
Closing |
Open |
Range |
Volume |
Fri 11 April 2025 |
1695.79 (-0.56%) |
1700.00 |
1692.30 - 1700.00 |
2.3685 times |
Wed 09 April 2025 |
1705.26 (-0.12%) |
1700.00 |
1700.00 - 1705.26 |
0.7106 times |
Tue 08 April 2025 |
1707.30 (0.96%) |
1691.00 |
1691.00 - 1707.30 |
1.909 times |
Fri 04 April 2025 |
1691.00 (-1.08%) |
1691.00 |
1691.00 - 1691.00 |
2.3685 times |
Wed 02 April 2025 |
1709.41 (6.03%) |
1690.00 |
1690.00 - 1709.41 |
0.4974 times |
Mon 20 January 2025 |
1612.25 (0.12%) |
1612.25 |
1612.25 - 1612.25 |
0.7627 times |
Thu 09 January 2025 |
1610.25 (-7.67%) |
1610.25 |
1610.25 - 1610.25 |
0.9332 times |
Wed 01 January 2025 |
1744.00 (5.71%) |
1744.00 |
1744.00 - 1744.00 |
0.0568 times |
Tue 31 December 2024 |
1649.80 (0%) |
1649.80 |
1649.80 - 1649.80 |
0.0237 times |
Mon 30 December 2024 |
1649.80 (3.1%) |
1649.80 |
1649.80 - 1649.80 |
0.3695 times |
Fri 27 December 2024 |
1600.20 (-2.66%) |
1600.20 |
1600.20 - 1600.20 |
0.3316 times |
Weekly price and charts 0mhil26 Strong weekly Stock price targets for 0mhil26 936656 are 1693.4 and 1709.7 | Weekly Target 1 | 1681.73 | | Weekly Target 2 | 1688.76 | | Weekly Target 3 | 1698.03 | | Weekly Target 4 | 1705.06 | | Weekly Target 5 | 1714.33 |
Weekly price and volumes for 0mhil26
| Date |
Closing |
Open |
Range |
Volume |
Fri 11 April 2025 |
1695.79 (0.28%) |
1691.00 |
1691.00 - 1707.30 |
2.3333 times |
Fri 04 April 2025 |
1691.00 (5.01%) |
1612.25 |
1612.25 - 1709.41 |
1.6973 times |
Thu 09 January 2025 |
1610.25 (0.63%) |
1649.80 |
1610.25 - 1744.00 |
0.647 times |
Fri 27 December 2024 |
1600.20 (-0.83%) |
1644.00 |
1600.00 - 1644.00 |
0.2792 times |
Thu 24 October 2024 |
1613.63 (-2.5%) |
1655.00 |
1613.63 - 1655.00 |
0.0953 times |
Thu 26 September 2024 |
1655.00 (0.01%) |
1654.75 |
1654.75 - 1655.00 |
0.1219 times |
Thu 19 September 2024 |
1654.90 (3.56%) |
1598.00 |
1598.00 - 1655.00 |
2.7476 times |
Fri 13 September 2024 |
1598.00 (-0.06%) |
1545.00 |
1545.00 - 1599.00 |
0.2371 times |
Thu 05 September 2024 |
1599.00 (3.5%) |
1546.50 |
1546.50 - 1599.00 |
1.3273 times |
Wed 28 August 2024 |
1545.00 (0.96%) |
1542.00 |
1542.00 - 1545.00 |
0.5141 times |
Fri 02 August 2024 |
1530.25 (-1.21%) |
1550.00 |
1530.25 - 1550.00 |
0.3102 times |

Monthly price and charts 0mhil26 Strong monthly Stock price targets for 0mhil26 936656 are 1692.9 and 1712.31 | Monthly Target 1 | 1678.99 | | Monthly Target 2 | 1687.39 | | Monthly Target 3 | 1698.4 | | Monthly Target 4 | 1706.8 | | Monthly Target 5 | 1717.81 |
Monthly price and volumes 0mhil26
| Date |
Closing |
Open |
Range |
Volume |
Fri 11 April 2025 |
1695.79 (5.18%) |
1690.00 |
1690.00 - 1709.41 |
2.5662 times |
Mon 20 January 2025 |
1612.25 (-2.28%) |
1744.00 |
1610.25 - 1744.00 |
0.5727 times |
Tue 31 December 2024 |
1649.80 (2.24%) |
1644.00 |
1600.00 - 1649.80 |
0.3235 times |
Thu 24 October 2024 |
1613.63 (-2.5%) |
1613.63 |
1613.63 - 1613.63 |
0.0201 times |
Mon 30 September 2024 |
1655.00 (7.12%) |
1546.50 |
1545.00 - 1655.00 |
3.1435 times |
Wed 28 August 2024 |
1545.00 (-0.32%) |
1530.25 |
1530.25 - 1545.00 |
0.5402 times |
Tue 25 June 2024 |
1550.00 (3.26%) |
1505.00 |
1500.00 - 1550.00 |
2.0631 times |
Wed 22 May 2024 |
1501.00 (-1.9%) |
1501.00 |
1501.00 - 1600.00 |
0.5928 times |
Mon 15 April 2024 |
1530.00 (0%) |
1530.00 |
1530.00 - 1530.00 |
0.1006 times |
Wed 20 December 2023 |
1530.00 (-1.22%) |
1530.00 |
1530.00 - 1530.00 |
0.0774 times |
Wed 25 October 2023 |
1548.95 (10.8%) |
1390.00 |
1390.00 - 1548.95 |
0.7182 times |

DMA SMA EMA moving averages of 0mhil26 936656
DMA (daily moving average) of 0mhil26 936656
| DMA period | DMA value | | 5 day DMA | 1701.75 | | 12 day DMA | 1668.26 | | 20 day DMA | 1659.57 | | 35 day DMA | 1622.9 | | 50 day DMA | 1570.63 | | 100 day DMA | 1438.61 | | 150 day DMA | | | 200 day DMA | | EMA (exponential moving average) of 0mhil26 936656
| EMA period | EMA current | EMA prev | EMA prev2 | | 5 day EMA | 1692.61 | 1691.02 | 1683.9 | | 12 day EMA | 1674.15 | 1670.22 | 1663.85 | | 20 day EMA | 1654.4 | 1650.05 | 1644.24 | | 35 day EMA | 1611.56 | 1606.6 | 1600.79 | | 50 day EMA | 1570 | 1564.87 | 1559.14 |
SMA (simple moving average) of 0mhil26 936656
| SMA period | SMA current | SMA prev | SMA prev2 | | 5 day SMA | 1701.75 | 1685.04 | 1666.04 | | 12 day SMA | 1668.26 | 1663.61 | 1658.5 | | 20 day SMA | 1659.57 | 1657.53 | 1652.16 | | 35 day SMA | 1622.9 | 1617.31 | 1611.44 | | 50 day SMA | 1570.63 | 1564.91 | 1558.81 | | 100 day SMA | 1438.61 | 1433.55 | 1427.54 | | 150 day SMA | | 200 day SMA |
|
|
