910tcfsl28 936294 full analysis,charts,indicators,moving averages,SMA,DMA,EMA,ADX,MACD,RSI910tcfsl28 936294 WideScreen charts, DMA,SMA,EMA technical analysis, forecast prediction, by indicators ADX,MACD,RSI,CCI BSE stock exchange
Daily price and charts and targets 910tcfsl28 Strong Daily Stock price targets for 910tcfsl28 936294 are 1060 and 1060 | Daily Target 1 | 1060 | | Daily Target 2 | 1060 | | Daily Target 3 | 1060 | | Daily Target 4 | 1060 | | Daily Target 5 | 1060 |
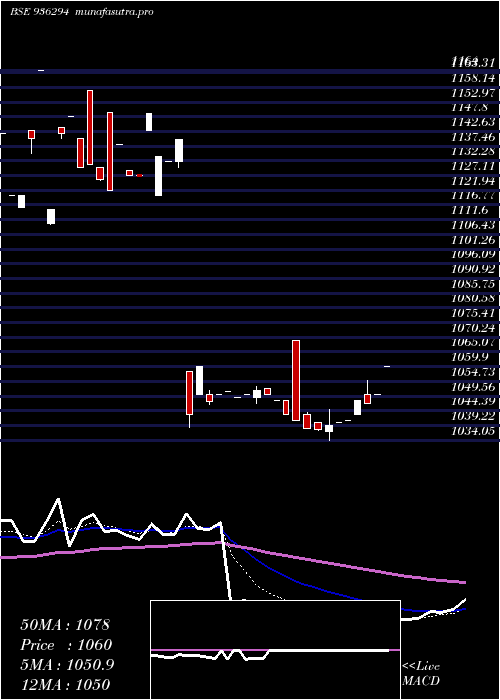
Daily price and volume 910tcfsl28
| Date |
Closing |
Open |
Range |
Volume |
Thu 23 October 2025 |
1060.00 (0.95%) |
1060.00 |
1060.00 - 1060.00 |
0.1206 times |
Mon 20 October 2025 |
1050.00 (0.28%) |
1050.00 |
1050.00 - 1050.00 |
0.217 times |
Tue 14 October 2025 |
1047.02 (-0.09%) |
1050.00 |
1047.02 - 1055.00 |
1.1044 times |
Mon 13 October 2025 |
1048.00 (0.67%) |
1043.00 |
1043.00 - 1048.00 |
0.2532 times |
Fri 10 October 2025 |
1041.00 (0.08%) |
1041.00 |
1041.00 - 1041.00 |
0.1206 times |
Thu 09 October 2025 |
1040.15 (0.1%) |
1040.15 |
1040.15 - 1040.15 |
0.1206 times |
Wed 08 October 2025 |
1039.07 (0.12%) |
1037.00 |
1034.05 - 1044.90 |
2.2643 times |
Tue 07 October 2025 |
1037.87 (-0.01%) |
1040.00 |
1037.55 - 1040.00 |
2.0786 times |
Mon 06 October 2025 |
1038.00 (-0.29%) |
1043.00 |
1038.00 - 1043.70 |
1.6446 times |
Fri 03 October 2025 |
1041.05 (-0.19%) |
1069.07 |
1041.05 - 1069.07 |
2.0762 times |
Wed 01 October 2025 |
1043.00 (-0.48%) |
1048.00 |
1043.00 - 1048.00 |
0.2894 times |
Weekly price and charts 910tcfsl28 Strong weekly Stock price targets for 910tcfsl28 936294 are 1055 and 1065 | Weekly Target 1 | 1046.67 | | Weekly Target 2 | 1053.33 | | Weekly Target 3 | 1056.6666666667 | | Weekly Target 4 | 1063.33 | | Weekly Target 5 | 1066.67 |
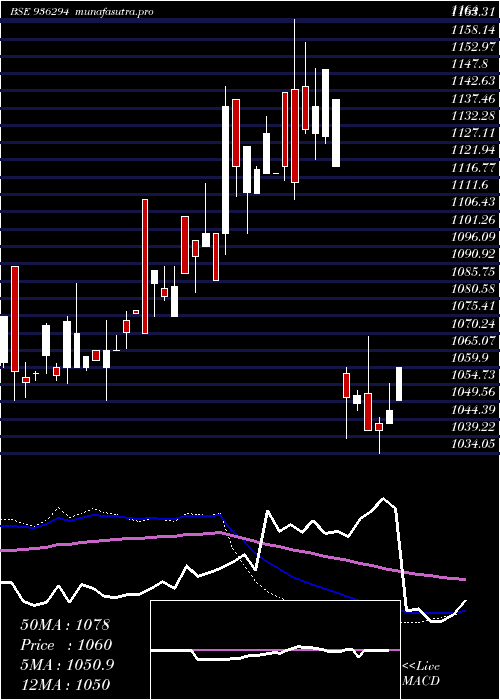
Weekly price and volumes for 910tcfsl28
| Date |
Closing |
Open |
Range |
Volume |
Thu 23 October 2025 |
1060.00 (1.24%) |
1050.00 |
1050.00 - 1060.00 |
0.1302 times |
Tue 14 October 2025 |
1047.02 (0.58%) |
1043.00 |
1043.00 - 1055.00 |
0.5234 times |
Fri 10 October 2025 |
1041.00 (-0%) |
1043.00 |
1034.05 - 1044.90 |
2.4015 times |
Fri 03 October 2025 |
1041.05 (-0.99%) |
1052.00 |
1041.05 - 1069.07 |
1.2328 times |
Fri 26 September 2025 |
1051.50 (0.05%) |
1049.00 |
1047.00 - 1053.00 |
1.7971 times |
Fri 19 September 2025 |
1051.00 (-7.8%) |
1058.00 |
1038.50 - 1060.00 |
0.9595 times |
Thu 11 September 2025 |
1139.90 (-0.8%) |
1120.10 |
1120.10 - 1139.90 |
0.9697 times |
Fri 05 September 2025 |
1149.09 (0.98%) |
1129.00 |
1127.00 - 1149.09 |
0.609 times |
Fri 29 August 2025 |
1137.97 (0.62%) |
1130.00 |
1122.00 - 1149.50 |
0.6499 times |
Fri 22 August 2025 |
1131.00 (1.42%) |
1144.00 |
1130.00 - 1157.00 |
0.727 times |
Fri 25 July 2025 |
1115.20 (-0.43%) |
1142.97 |
1110.00 - 1164.00 |
0.8488 times |
Monthly price and charts 910tcfsl28 Strong monthly Stock price targets for 910tcfsl28 936294 are 1047.03 and 1082.05 | Monthly Target 1 | 1019.35 | | Monthly Target 2 | 1039.68 | | Monthly Target 3 | 1054.3733333333 | | Monthly Target 4 | 1074.7 | | Monthly Target 5 | 1089.39 |
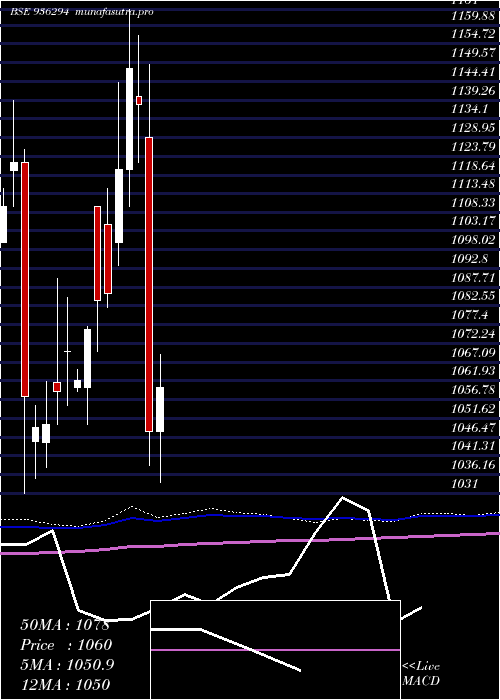
Monthly price and volumes 910tcfsl28
| Date |
Closing |
Open |
Range |
Volume |
Thu 23 October 2025 |
1060.00 (1.15%) |
1048.00 |
1034.05 - 1069.07 |
1.5621 times |
Tue 30 September 2025 |
1048.00 (-7.91%) |
1129.00 |
1038.50 - 1149.09 |
1.8334 times |
Fri 29 August 2025 |
1137.97 (-0.86%) |
1140.10 |
1122.00 - 1157.00 |
0.3895 times |
Wed 30 July 2025 |
1147.89 (2.49%) |
1120.00 |
1110.00 - 1164.00 |
0.7366 times |
Mon 30 June 2025 |
1120.00 (3.13%) |
1100.00 |
1093.74 - 1143.99 |
1.4603 times |
Fri 30 May 2025 |
1086.00 (0.18%) |
1105.00 |
1082.25 - 1115.00 |
1.1898 times |
Wed 30 April 2025 |
1084.01 (0.74%) |
1110.00 |
1070.00 - 1110.00 |
0.7146 times |
Fri 28 March 2025 |
1076.01 (1.32%) |
1060.00 |
1050.00 - 1077.00 |
0.8727 times |
Fri 28 February 2025 |
1062.00 (-0.75%) |
1060.02 |
1059.00 - 1065.00 |
0.3815 times |
Thu 30 January 2025 |
1070.00 (1.04%) |
1070.00 |
1055.00 - 1084.99 |
0.8596 times |
Tue 31 December 2024 |
1059.00 (0.86%) |
1061.45 |
1050.00 - 1090.00 |
3.3142 times |
DMA SMA EMA moving averages of 910tcfsl28 936294
DMA (daily moving average) of 910tcfsl28 936294
| DMA period | DMA value | | 5 day DMA | 1049.2 | | 12 day DMA | 1044.43 | | 20 day DMA | 1047.12 | | 35 day DMA | 1081.31 | | 50 day DMA | 1094.97 | | 100 day DMA | 1090.87 | | 150 day DMA | 1079.69 | | 200 day DMA | 1083.5 | EMA (exponential moving average) of 910tcfsl28 936294
| EMA period | EMA current | EMA prev | EMA prev2 | | 5 day EMA | 1050.85 | 1046.27 | 1044.41 | | 12 day EMA | 1049.97 | 1048.15 | 1047.81 | | 20 day EMA | 1057.1 | 1056.79 | 1057.5 | | 35 day EMA | 1071.54 | 1072.22 | 1073.53 | | 50 day EMA | 1091.74 | 1093.03 | 1094.79 |
SMA (simple moving average) of 910tcfsl28 936294
| SMA period | SMA current | SMA prev | SMA prev2 | | 5 day SMA | 1049.2 | 1045.23 | 1043.05 | | 12 day SMA | 1044.43 | 1043.6 | 1043.72 | | 20 day SMA | 1047.12 | 1046.27 | 1050.77 | | 35 day SMA | 1081.31 | 1084.29 | 1086.87 | | 50 day SMA | 1094.97 | 1096.01 | 1097.52 | | 100 day SMA | 1090.87 | 1090.92 | 1091.05 | | 150 day SMA | 1079.69 | 1079.62 | 1079.65 | | 200 day SMA | 1083.5 | 1083.73 | 1084 |
|
|
