774ireda31 935618 full analysis,charts,indicators,moving averages,SMA,DMA,EMA,ADX,MACD,RSI774ireda31 935618 WideScreen charts, DMA,SMA,EMA technical analysis, forecast prediction, by indicators ADX,MACD,RSI,CCI BSE stock exchange
Daily price and charts and targets 774ireda31 Strong Daily Stock price targets for 774ireda31 935618 are 1163.77 and 1164.82 | Daily Target 1 | 1163.48 | | Daily Target 2 | 1164.05 | | Daily Target 3 | 1164.5266666667 | | Daily Target 4 | 1165.1 | | Daily Target 5 | 1165.58 |
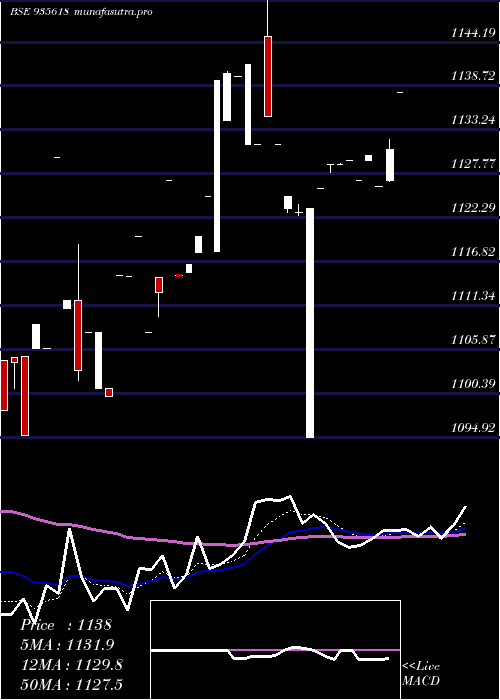
Daily price and volume 774ireda31
| Date |
Closing |
Open |
Range |
Volume |
Fri 05 December 2025 |
1164.63 (0.23%) |
1165.00 |
1163.95 - 1165.00 |
2.0673 times |
Thu 04 December 2025 |
1162.00 (-0.26%) |
1160.11 |
1160.11 - 1162.00 |
0.4791 times |
Tue 02 December 2025 |
1165.05 (0.01%) |
1165.00 |
1165.00 - 1165.50 |
0.3021 times |
Tue 18 November 2025 |
1164.99 (-0%) |
1165.00 |
1164.99 - 1165.00 |
1.1394 times |
Mon 10 November 2025 |
1165.00 (0%) |
1165.00 |
1165.00 - 1165.00 |
0.0237 times |
Mon 03 November 2025 |
1164.99 (0.69%) |
1164.99 |
1164.99 - 1164.99 |
0.0216 times |
Wed 29 October 2025 |
1156.98 (0.1%) |
1156.04 |
1156.04 - 1164.80 |
1.5408 times |
Tue 28 October 2025 |
1155.84 (0.51%) |
1162.00 |
1155.00 - 1163.00 |
3.0384 times |
Fri 17 October 2025 |
1150.00 (-0.39%) |
1150.00 |
1150.00 - 1150.00 |
0.4855 times |
Thu 16 October 2025 |
1154.47 (0.22%) |
1153.00 |
1153.00 - 1154.47 |
0.902 times |
Wed 15 October 2025 |
1151.99 (0.52%) |
1151.99 |
1151.99 - 1151.99 |
0.0539 times |
Weekly price and charts 774ireda31 Strong weekly Stock price targets for 774ireda31 935618 are 1159.68 and 1165.07 | Weekly Target 1 | 1158.02 | | Weekly Target 2 | 1161.33 | | Weekly Target 3 | 1163.4133333333 | | Weekly Target 4 | 1166.72 | | Weekly Target 5 | 1168.8 |
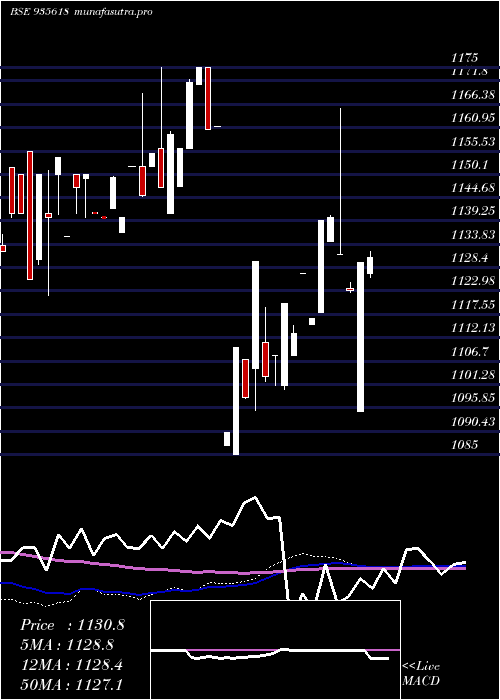
Weekly price and volumes for 774ireda31
| Date |
Closing |
Open |
Range |
Volume |
Fri 05 December 2025 |
1164.63 (-0.03%) |
1165.00 |
1160.11 - 1165.50 |
0.9334 times |
Tue 18 November 2025 |
1164.99 (0%) |
1165.00 |
1164.99 - 1165.00 |
0.3811 times |
Mon 03 November 2025 |
1164.99 (0.69%) |
1164.99 |
1164.99 - 1164.99 |
0.0071 times |
Wed 29 October 2025 |
1156.98 (0.61%) |
1162.00 |
1155.00 - 1164.80 |
1.5005 times |
Fri 17 October 2025 |
1150.00 (0.26%) |
1146.00 |
1146.00 - 1154.47 |
0.8669 times |
Fri 10 October 2025 |
1146.99 (0.5%) |
1142.81 |
1142.80 - 1146.99 |
2.6517 times |
Fri 26 September 2025 |
1141.30 (-0.06%) |
1141.99 |
1139.00 - 1142.50 |
0.7418 times |
Fri 19 September 2025 |
1141.99 (0.17%) |
1140.01 |
1138.00 - 1142.00 |
1.6546 times |
Fri 22 August 2025 |
1140.00 (0.44%) |
1137.00 |
1133.52 - 1140.00 |
0.9666 times |
Fri 08 August 2025 |
1135.00 (0.3%) |
1132.00 |
1132.00 - 1135.00 |
0.2963 times |
Fri 01 August 2025 |
1131.62 (-0.56%) |
1133.00 |
1130.01 - 1133.10 |
1.0663 times |
Monthly price and charts 774ireda31 Strong monthly Stock price targets for 774ireda31 935618 are 1159.68 and 1165.07 | Monthly Target 1 | 1158.02 | | Monthly Target 2 | 1161.33 | | Monthly Target 3 | 1163.4133333333 | | Monthly Target 4 | 1166.72 | | Monthly Target 5 | 1168.8 |
Monthly price and volumes 774ireda31
| Date |
Closing |
Open |
Range |
Volume |
Fri 05 December 2025 |
1164.63 (-0.03%) |
1165.00 |
1160.11 - 1165.50 |
0.326 times |
Tue 18 November 2025 |
1164.99 (0.69%) |
1164.99 |
1164.99 - 1165.00 |
0.1356 times |
Wed 29 October 2025 |
1156.98 (1.37%) |
1142.81 |
1142.80 - 1164.80 |
1.753 times |
Fri 26 September 2025 |
1141.30 (0.11%) |
1140.01 |
1138.00 - 1142.50 |
0.837 times |
Fri 22 August 2025 |
1140.00 (0.7%) |
1133.10 |
1131.00 - 1140.00 |
0.5893 times |
Thu 31 July 2025 |
1132.03 (0.76%) |
1126.01 |
1126.01 - 1138.00 |
0.9782 times |
Mon 30 June 2025 |
1123.50 (0.31%) |
1125.00 |
1094.92 - 1165.45 |
3.3146 times |
Tue 20 May 2025 |
1120.00 (-0.62%) |
1115.21 |
1115.20 - 1120.00 |
0.2003 times |
Wed 30 April 2025 |
1126.99 (2.45%) |
1115.05 |
1108.00 - 1126.99 |
0.2657 times |
Mon 24 March 2025 |
1100.00 (-2.64%) |
1111.00 |
1100.00 - 1119.00 |
1.6004 times |
Fri 21 February 2025 |
1129.80 (2.06%) |
1105.00 |
1095.10 - 1129.80 |
1.2146 times |
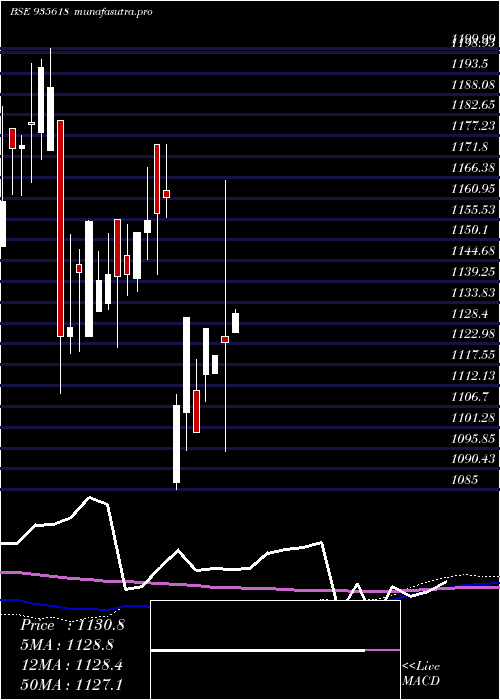
DMA SMA EMA moving averages of 774ireda31 935618
DMA (daily moving average) of 774ireda31 935618
| DMA period | DMA value | | 5 day DMA | 1164.33 | | 12 day DMA | 1158.5 | | 20 day DMA | 1151.71 | | 35 day DMA | 1143.78 | | 50 day DMA | 1140.03 | | 100 day DMA | 1134.76 | | 150 day DMA | 1136.97 | | 200 day DMA | 1141.3 | EMA (exponential moving average) of 774ireda31 935618
| EMA period | EMA current | EMA prev | EMA prev2 | | 5 day EMA | 1163.2 | 1162.48 | 1162.72 | | 12 day EMA | 1158.54 | 1157.43 | 1156.6 | | 20 day EMA | 1153.62 | 1152.46 | 1151.46 | | 35 day EMA | 1146.95 | 1145.91 | 1144.96 | | 50 day EMA | 1140.66 | 1139.68 | 1138.77 |
SMA (simple moving average) of 774ireda31 935618
| SMA period | SMA current | SMA prev | SMA prev2 | | 5 day SMA | 1164.33 | 1164.41 | 1163.4 | | 12 day SMA | 1158.5 | 1157.03 | 1155.3 | | 20 day SMA | 1151.71 | 1150.48 | 1149.38 | | 35 day SMA | 1143.78 | 1142.78 | 1141.83 | | 50 day SMA | 1140.03 | 1139.14 | 1138.23 | | 100 day SMA | 1134.76 | 1134.63 | 1134.41 | | 150 day SMA | 1136.97 | 1136.74 | 1136.48 | | 200 day SMA | 1141.3 | 1141.38 | 1141.47 |
|
|
