739nhai26 935580 full analysis,charts,indicators,moving averages,SMA,DMA,EMA,ADX,MACD,RSI739nhai26 935580 WideScreen charts, DMA,SMA,EMA technical analysis, forecast prediction, by indicators ADX,MACD,RSI,CCI BSE stock exchange
Daily price and charts and targets 739nhai26 Strong Daily Stock price targets for 739nhai26 935580 are 1048.98 and 1048.99 | Daily Target 1 | 1048.97 | | Daily Target 2 | 1048.98 | | Daily Target 3 | 1048.9833333333 | | Daily Target 4 | 1048.99 | | Daily Target 5 | 1048.99 |
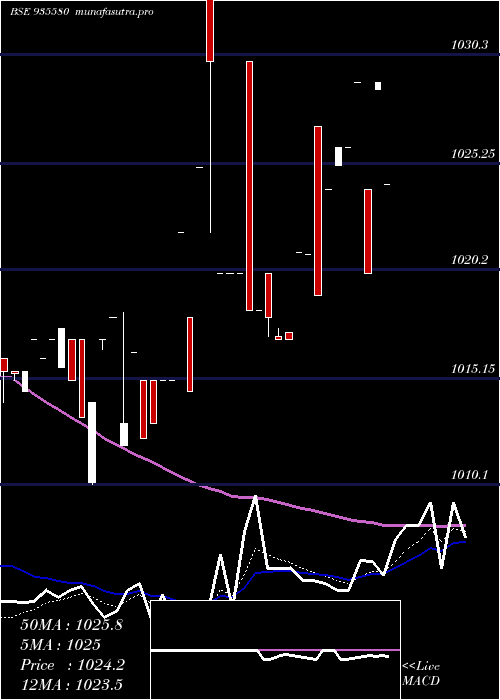
Daily price and volume 739nhai26
| Date |
Closing |
Open |
Range |
Volume |
Tue 21 October 2025 |
1048.98 (-0.1%) |
1048.99 |
1048.98 - 1048.99 |
0.7968 times |
Mon 20 October 2025 |
1049.99 (1.06%) |
1049.99 |
1049.99 - 1049.99 |
0.7968 times |
Mon 13 October 2025 |
1039.00 (0%) |
1039.00 |
1039.00 - 1039.00 |
1.2231 times |
Fri 10 October 2025 |
1039.00 (-0.48%) |
1040.00 |
1039.00 - 1040.00 |
1.5139 times |
Wed 08 October 2025 |
1044.00 (1.03%) |
1044.00 |
1044.00 - 1044.00 |
0.1434 times |
Thu 25 September 2025 |
1033.34 (-0.12%) |
1035.00 |
1033.30 - 1035.00 |
1.1155 times |
Wed 17 September 2025 |
1034.60 (-0.42%) |
1034.60 |
1034.60 - 1034.60 |
0.0199 times |
Thu 11 September 2025 |
1038.99 (0.63%) |
1032.50 |
1032.50 - 1038.99 |
4.0279 times |
Wed 10 September 2025 |
1032.50 (0.05%) |
1032.06 |
1032.06 - 1032.50 |
0.2829 times |
Tue 09 September 2025 |
1032.00 (0.26%) |
1032.00 |
1032.00 - 1032.00 |
0.0797 times |
Mon 08 September 2025 |
1029.33 (-0.5%) |
1029.33 |
1029.33 - 1029.33 |
0.0717 times |
Weekly price and charts 739nhai26 Strong weekly Stock price targets for 739nhai26 935580 are 1048.48 and 1049.49 | Weekly Target 1 | 1048.31 | | Weekly Target 2 | 1048.64 | | Weekly Target 3 | 1049.3166666667 | | Weekly Target 4 | 1049.65 | | Weekly Target 5 | 1050.33 |
Weekly price and volumes for 739nhai26
| Date |
Closing |
Open |
Range |
Volume |
Tue 21 October 2025 |
1048.98 (0.96%) |
1049.99 |
1048.98 - 1049.99 |
1.0025 times |
Mon 13 October 2025 |
1039.00 (0%) |
1039.00 |
1039.00 - 1039.00 |
0.7694 times |
Fri 10 October 2025 |
1039.00 (0.55%) |
1044.00 |
1039.00 - 1044.00 |
1.0426 times |
Thu 25 September 2025 |
1033.34 (-0.54%) |
1034.60 |
1033.30 - 1035.00 |
0.7143 times |
Thu 11 September 2025 |
1038.99 (0.43%) |
1029.33 |
1029.33 - 1038.99 |
2.807 times |
Thu 04 September 2025 |
1034.50 (1.12%) |
1030.00 |
1030.00 - 1034.50 |
0.3835 times |
Mon 11 August 2025 |
1023.02 (-0.68%) |
1023.01 |
1023.01 - 1025.02 |
2.5138 times |
Fri 08 August 2025 |
1030.00 (0.39%) |
1030.00 |
1030.00 - 1030.00 |
0.6266 times |
Thu 31 July 2025 |
1026.00 (0.18%) |
1025.25 |
1025.25 - 1026.00 |
0.015 times |
Thu 24 July 2025 |
1024.20 (-0.47%) |
1024.20 |
1024.20 - 1024.20 |
0.1253 times |
Thu 17 July 2025 |
1028.99 (-0%) |
1024.00 |
1020.00 - 1028.99 |
5.0175 times |

Monthly price and charts 739nhai26 Strong monthly Stock price targets for 739nhai26 935580 are 1043.99 and 1054.98 | Monthly Target 1 | 1035 | | Monthly Target 2 | 1041.99 | | Monthly Target 3 | 1045.99 | | Monthly Target 4 | 1052.98 | | Monthly Target 5 | 1056.98 |
Monthly price and volumes 739nhai26
| Date |
Closing |
Open |
Range |
Volume |
Tue 21 October 2025 |
1048.98 (1.51%) |
1044.00 |
1039.00 - 1049.99 |
0.3552 times |
Thu 25 September 2025 |
1033.34 (1.01%) |
1030.00 |
1029.33 - 1038.99 |
0.4928 times |
Mon 11 August 2025 |
1023.02 (-0.29%) |
1030.00 |
1023.01 - 1030.00 |
0.3963 times |
Thu 31 July 2025 |
1026.00 (0.49%) |
1027.00 |
1019.02 - 1029.00 |
1.1609 times |
Thu 26 June 2025 |
1020.99 (0.1%) |
1020.00 |
1017.01 - 1030.00 |
0.4533 times |
Fri 30 May 2025 |
1020.00 (0.59%) |
1017.00 |
1012.01 - 1190.00 |
1.3478 times |
Wed 30 April 2025 |
1014.00 (0.96%) |
1005.56 |
1005.50 - 1017.48 |
1.6673 times |
Fri 28 March 2025 |
1004.31 (-6.66%) |
1073.01 |
1000.80 - 1077.49 |
2.2866 times |
Mon 24 February 2025 |
1076.00 (0.19%) |
1071.50 |
1071.20 - 1076.50 |
0.1873 times |
Tue 28 January 2025 |
1073.99 (-0.03%) |
1062.19 |
1062.19 - 1075.00 |
1.6524 times |
Tue 31 December 2024 |
1074.31 (0.87%) |
1066.00 |
1060.67 - 1160.00 |
0.8341 times |

DMA SMA EMA moving averages of 739nhai26 935580
DMA (daily moving average) of 739nhai26 935580
| DMA period | DMA value | | 5 day DMA | 1044.19 | | 12 day DMA | 1038.02 | | 20 day DMA | 1033.92 | | 35 day DMA | 1028.37 | | 50 day DMA | 1025.03 | | 100 day DMA | 1036.87 | | 150 day DMA | 1042.42 | | 200 day DMA | 1046.28 | EMA (exponential moving average) of 739nhai26 935580
| EMA period | EMA current | EMA prev | EMA prev2 | | 5 day EMA | 1044.42 | 1042.14 | 1038.21 | | 12 day EMA | 1039.16 | 1037.38 | 1035.09 | | 20 day EMA | 1035.34 | 1033.91 | 1032.22 | | 35 day EMA | 1030.53 | 1029.44 | 1028.23 | | 50 day EMA | 1026.27 | 1025.34 | 1024.33 |
SMA (simple moving average) of 739nhai26 935580
| SMA period | SMA current | SMA prev | SMA prev2 | | 5 day SMA | 1044.19 | 1041.07 | 1037.99 | | 12 day SMA | 1038.02 | 1036.44 | 1034.77 | | 20 day SMA | 1033.92 | 1032.47 | 1031.42 | | 35 day SMA | 1028.37 | 1027.54 | 1026.97 | | 50 day SMA | 1025.03 | 1024.35 | 1023.7 | | 100 day SMA | 1036.87 | 1037.05 | 1037.21 | | 150 day SMA | 1042.42 | 1042.39 | 1042.32 | | 200 day SMA | 1046.28 | 1046.44 | 1046.61 |
|
|
