690goi65 800808 full analysis,charts,indicators,moving averages,SMA,DMA,EMA,ADX,MACD,RSI690goi65 800808 WideScreen charts, DMA,SMA,EMA technical analysis, forecast prediction, by indicators ADX,MACD,RSI,CCI BSE stock exchange
Daily price and charts and targets 690goi65 Strong Daily Stock price targets for 690goi65 800808 are 94.5 and 95.5 | Daily Target 1 | 94.33 | | Daily Target 2 | 94.67 | | Daily Target 3 | 95.333333333333 | | Daily Target 4 | 95.67 | | Daily Target 5 | 96.33 |
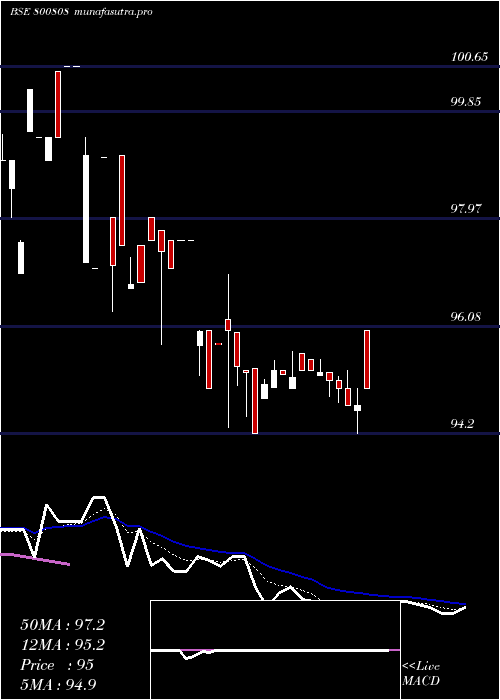
Daily price and volume 690goi65
| Date |
Closing |
Open |
Range |
Volume |
Fri 05 December 2025 |
95.00 (0.32%) |
96.00 |
95.00 - 96.00 |
0.0142 times |
Thu 04 December 2025 |
94.70 (0%) |
94.60 |
94.20 - 95.00 |
4.6133 times |
Wed 03 December 2025 |
94.70 (-0.32%) |
95.00 |
94.70 - 95.30 |
0.1254 times |
Tue 02 December 2025 |
95.00 (-0.15%) |
95.14 |
94.75 - 95.20 |
0.389 times |
Mon 01 December 2025 |
95.14 (-0.15%) |
95.28 |
94.85 - 95.28 |
0.9828 times |
Fri 28 November 2025 |
95.28 (-0.02%) |
95.22 |
95.22 - 95.50 |
0.9632 times |
Thu 27 November 2025 |
95.30 (0%) |
95.50 |
95.30 - 95.50 |
0.4187 times |
Wed 26 November 2025 |
95.30 (0.12%) |
95.60 |
95.30 - 95.60 |
0.9218 times |
Tue 25 November 2025 |
95.19 (-0.05%) |
95.00 |
95.00 - 95.64 |
1.5587 times |
Mon 24 November 2025 |
95.24 (-0.06%) |
95.30 |
95.24 - 95.30 |
0.013 times |
Fri 21 November 2025 |
95.30 (0.25%) |
95.01 |
95.01 - 95.48 |
0.0852 times |
Weekly price and charts 690goi65 Strong weekly Stock price targets for 690goi65 800808 are 93.7 and 95.5 | Weekly Target 1 | 93.27 | | Weekly Target 2 | 94.13 | | Weekly Target 3 | 95.066666666667 | | Weekly Target 4 | 95.93 | | Weekly Target 5 | 96.87 |
Weekly price and volumes for 690goi65
| Date |
Closing |
Open |
Range |
Volume |
Fri 05 December 2025 |
95.00 (-0.29%) |
95.28 |
94.20 - 96.00 |
0.9462 times |
Fri 28 November 2025 |
95.28 (-0.02%) |
95.30 |
95.00 - 95.64 |
0.5987 times |
Fri 21 November 2025 |
95.30 (-0.08%) |
95.30 |
94.20 - 95.48 |
0.5402 times |
Fri 14 November 2025 |
95.38 (0.4%) |
95.79 |
94.31 - 97.00 |
0.5973 times |
Fri 07 November 2025 |
95.00 (-2.16%) |
97.60 |
95.00 - 97.60 |
2.3296 times |
Thu 30 October 2025 |
97.10 (0.29%) |
97.50 |
95.76 - 98.00 |
3.7044 times |
Thu 23 October 2025 |
96.82 (-2.24%) |
98.00 |
96.35 - 99.09 |
0.2063 times |
Fri 17 October 2025 |
99.04 (-0.04%) |
97.10 |
97.10 - 99.04 |
0.0013 times |
Fri 10 October 2025 |
99.08 (-0.32%) |
99.00 |
97.20 - 100.65 |
0.827 times |
Fri 03 October 2025 |
99.40 (0.4%) |
97.02 |
97.02 - 100.25 |
0.249 times |
Fri 12 September 2025 |
99.00 (2.59%) |
98.00 |
96.50 - 100.25 |
0.1826 times |

Monthly price and charts 690goi65 Strong monthly Stock price targets for 690goi65 800808 are 93.7 and 95.5 | Monthly Target 1 | 93.27 | | Monthly Target 2 | 94.13 | | Monthly Target 3 | 95.066666666667 | | Monthly Target 4 | 95.93 | | Monthly Target 5 | 96.87 |
Monthly price and volumes 690goi65
| Date |
Closing |
Open |
Range |
Volume |
Fri 05 December 2025 |
95.00 (-0.29%) |
95.28 |
94.20 - 96.00 |
0.318 times |
Fri 28 November 2025 |
95.28 (-1.87%) |
97.60 |
94.20 - 97.60 |
1.3664 times |
Thu 30 October 2025 |
97.10 (-0.47%) |
99.51 |
95.76 - 100.65 |
1.6752 times |
Mon 15 September 2025 |
97.56 (1.1%) |
98.00 |
96.50 - 100.25 |
0.0624 times |
Thu 28 August 2025 |
96.50 (-3.99%) |
100.00 |
96.40 - 100.00 |
0.3285 times |
Thu 31 July 2025 |
100.51 (0%) |
99.75 |
98.50 - 100.51 |
2.2495 times |
Sun 07 December 2025 |
(0%) |
|
- |
0 times |

DMA SMA EMA moving averages of 690goi65 800808
DMA (daily moving average) of 690goi65 800808
| DMA period | DMA value | | 5 day DMA | 94.91 | | 12 day DMA | 95.1 | | 20 day DMA | 95.32 | | 35 day DMA | 96.56 | | 50 day DMA | 97.21 | | 100 day DMA | | | 150 day DMA | | | 200 day DMA | | EMA (exponential moving average) of 690goi65 800808
| EMA period | EMA current | EMA prev | EMA prev2 | | 5 day EMA | 94.93 | 94.9 | 95 | | 12 day EMA | 95.15 | 95.18 | 95.27 | | 20 day EMA | 95.54 | 95.6 | 95.7 | | 35 day EMA | 96.31 | 96.39 | 96.49 | | 50 day EMA | 97.21 | 97.3 | 97.41 |
SMA (simple moving average) of 690goi65 800808
| SMA period | SMA current | SMA prev | SMA prev2 | | 5 day SMA | 94.91 | 94.96 | 95.08 | | 12 day SMA | 95.1 | 95.03 | 95.08 | | 20 day SMA | 95.32 | 95.45 | 95.57 | | 35 day SMA | 96.56 | 96.69 | 96.85 | | 50 day SMA | 97.21 | 97.31 | 97.43 | | 100 day SMA | | 150 day SMA | | 200 day SMA |
|
|
