Sgbfeb29 800333 full analysis,charts,indicators,moving averages,SMA,DMA,EMA,ADX,MACD,RSISgbfeb29 800333 WideScreen charts, DMA,SMA,EMA technical analysis, forecast prediction, by indicators ADX,MACD,RSI,CCI BSE stock exchange
Daily price and charts and targets Sgbfeb29 Strong Daily Stock price targets for Sgbfeb29 800333 are 9378.84 and 9435.84 | Daily Target 1 | 9332.23 | | Daily Target 2 | 9368.45 | | Daily Target 3 | 9389.2266666667 | | Daily Target 4 | 9425.45 | | Daily Target 5 | 9446.23 |
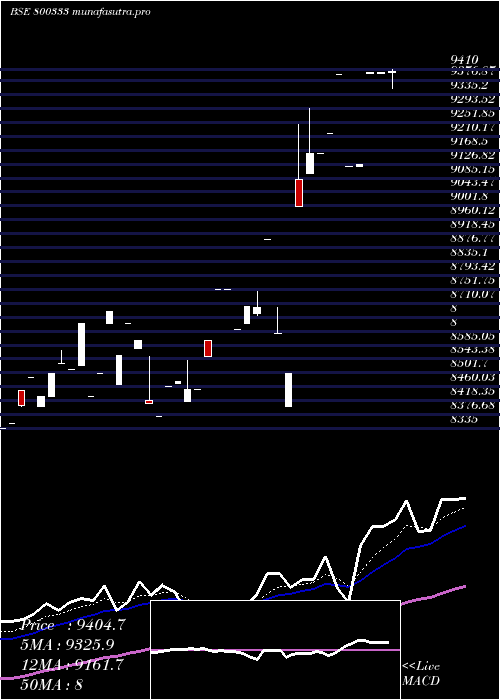
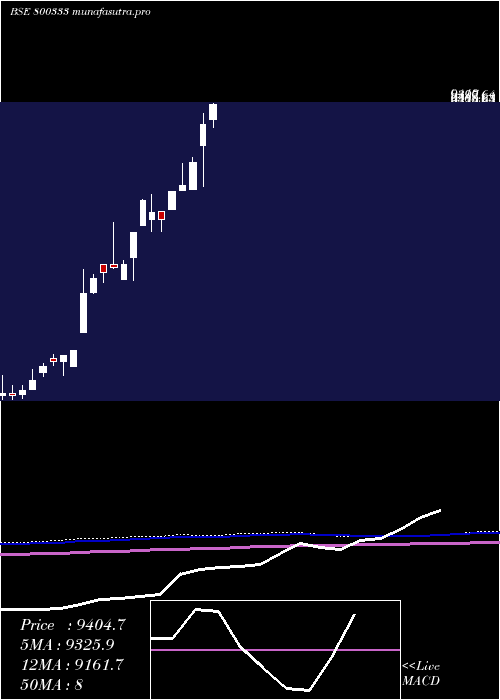
Daily price and volume Sgbfeb29
| Date |
Closing |
Open |
Range |
Volume |
Fri 23 May 2025 |
9404.68 (0.05%) |
9400.00 |
9353.00 - 9410.00 |
1.3768 times |
Thu 22 May 2025 |
9400.00 (0%) |
9398.00 |
9398.00 - 9400.00 |
1.4855 times |
Wed 21 May 2025 |
9400.00 (3.01%) |
9398.99 |
9398.99 - 9400.00 |
1.2681 times |
Fri 16 May 2025 |
9125.10 (0.07%) |
9120.01 |
9120.01 - 9125.10 |
0.6159 times |
Thu 15 May 2025 |
9118.99 (-2.94%) |
9118.99 |
9118.99 - 9119.00 |
3.442 times |
Fri 09 May 2025 |
9394.99 (1.9%) |
9394.99 |
9394.99 - 9394.99 |
0.0362 times |
Tue 06 May 2025 |
9220.00 (0.66%) |
9220.00 |
9220.00 - 9220.00 |
0.0362 times |
Fri 25 April 2025 |
9160.00 (-0%) |
9160.00 |
9160.00 - 9160.00 |
0.3623 times |
Tue 22 April 2025 |
9160.10 (1.77%) |
9100.00 |
9100.00 - 9295.00 |
0.6884 times |
Mon 21 April 2025 |
9001.00 (5.89%) |
9080.00 |
9001.00 - 9245.00 |
0.6884 times |
Wed 09 April 2025 |
8500.00 (-1.39%) |
8400.11 |
8400.11 - 8500.00 |
0.5072 times |
Weekly price and charts Sgbfeb29 Strong weekly Stock price targets for Sgbfeb29 800333 are 9378.84 and 9435.84 | Weekly Target 1 | 9332.23 | | Weekly Target 2 | 9368.45 | | Weekly Target 3 | 9389.2266666667 | | Weekly Target 4 | 9425.45 | | Weekly Target 5 | 9446.23 |
Weekly price and volumes for Sgbfeb29
| Date |
Closing |
Open |
Range |
Volume |
Fri 23 May 2025 |
9404.68 (3.06%) |
9398.99 |
9353.00 - 9410.00 |
1.7378 times |
Fri 16 May 2025 |
9125.10 (-2.87%) |
9118.99 |
9118.99 - 9125.10 |
1.7073 times |
Fri 09 May 2025 |
9394.99 (2.57%) |
9220.00 |
9220.00 - 9394.99 |
0.0305 times |
Fri 25 April 2025 |
9160.00 (7.76%) |
9080.00 |
9001.00 - 9295.00 |
0.7317 times |
Wed 09 April 2025 |
8500.00 (-4.49%) |
8619.50 |
8400.11 - 8699.00 |
0.5488 times |
Wed 02 April 2025 |
8900.00 (2.31%) |
8900.00 |
8900.00 - 8900.00 |
0.061 times |
Fri 28 March 2025 |
8698.84 (-0.58%) |
8630.00 |
8630.00 - 8745.00 |
4.0549 times |
Fri 21 March 2025 |
8750.00 (3.53%) |
8599.00 |
8550.00 - 8751.00 |
0.7165 times |
Wed 12 March 2025 |
8452.00 (-0.09%) |
8470.00 |
8415.00 - 8540.00 |
0.2896 times |
Thu 06 March 2025 |
8460.00 (0.58%) |
8371.00 |
8371.00 - 8460.00 |
0.122 times |
Fri 28 February 2025 |
8411.01 (-1.68%) |
8650.00 |
8410.00 - 8650.00 |
1.0671 times |

Monthly price and charts Sgbfeb29 Strong monthly Stock price targets for Sgbfeb29 800333 are 9261.84 and 9552.85 | Monthly Target 1 | 9020.21 | | Monthly Target 2 | 9212.45 | | Monthly Target 3 | 9311.2233333333 | | Monthly Target 4 | 9503.46 | | Monthly Target 5 | 9602.23 |
Monthly price and volumes Sgbfeb29
| Date |
Closing |
Open |
Range |
Volume |
Fri 23 May 2025 |
9404.68 (2.67%) |
9220.00 |
9118.99 - 9410.00 |
1.518 times |
Fri 25 April 2025 |
9160.00 (5.3%) |
8900.00 |
8400.11 - 9295.00 |
0.5859 times |
Fri 28 March 2025 |
8698.84 (3.42%) |
8371.00 |
8371.00 - 8751.00 |
2.2636 times |
Fri 28 February 2025 |
8411.01 (0.91%) |
8350.00 |
8350.00 - 8685.00 |
1.0586 times |
Fri 31 January 2025 |
8335.00 (4.17%) |
8125.00 |
8121.00 - 8335.00 |
2.0639 times |
Fri 27 December 2024 |
8001.00 (-1.1%) |
8091.00 |
7850.00 - 8091.00 |
0.6858 times |
Fri 29 November 2024 |
8090.00 (-1.7%) |
8000.00 |
7850.00 - 8299.34 |
0.6525 times |
Tue 29 October 2024 |
8230.00 (4.93%) |
7928.27 |
7928.27 - 8248.78 |
0.0932 times |
Thu 19 September 2024 |
7843.45 (5.25%) |
7531.00 |
7252.00 - 7843.45 |
0.6991 times |
Tue 20 August 2024 |
7452.00 (0.57%) |
7270.06 |
7270.06 - 7500.00 |
0.3795 times |
Mon 29 July 2024 |
7410.00 (0.82%) |
7450.00 |
7400.00 - 7960.00 |
1.7643 times |
DMA SMA EMA moving averages of Sgbfeb29 800333
DMA (daily moving average) of Sgbfeb29 800333
| DMA period | DMA value | | 5 day DMA | 9289.75 | | 12 day DMA | 9125.36 | | 20 day DMA | 8946.94 | | 35 day DMA | 8763.4 | | 50 day DMA | 8603.66 | | 100 day DMA | 8123.49 | | 150 day DMA | 7623.36 | | 200 day DMA | 7208.46 | EMA (exponential moving average) of Sgbfeb29 800333
| EMA period | EMA current | EMA prev | EMA prev2 | | 5 day EMA | 9325.9 | 9286.51 | 9229.78 | | 12 day EMA | 9161.67 | 9117.5 | 9066.16 | | 20 day EMA | 9013.19 | 8972 | 8926.97 | | 35 day EMA | 8811.53 | 8776.61 | 8739.91 | | 50 day EMA | 8624.21 | 8592.37 | 8559.42 |
SMA (simple moving average) of Sgbfeb29 800333
| SMA period | SMA current | SMA prev | SMA prev2 | | 5 day SMA | 9289.75 | 9287.82 | 9251.82 | | 12 day SMA | 9125.36 | 9083.31 | 9024.88 | | 20 day SMA | 8946.94 | 8899.3 | 8853.05 | | 35 day SMA | 8763.4 | 8735.55 | 8709.52 | | 50 day SMA | 8603.66 | 8572.57 | 8546.17 | | 100 day SMA | 8123.49 | 8102.24 | 8081.13 | | 150 day SMA | 7623.36 | 7601.65 | 7579.98 | | 200 day SMA | 7208.46 | 7190.74 | 7173.04 |
|
|
