667goi2050 800330 full analysis,charts,indicators,moving averages,SMA,DMA,EMA,ADX,MACD,RSI667goi2050 800330 WideScreen charts, DMA,SMA,EMA technical analysis, forecast prediction, by indicators ADX,MACD,RSI,CCI BSE stock exchange
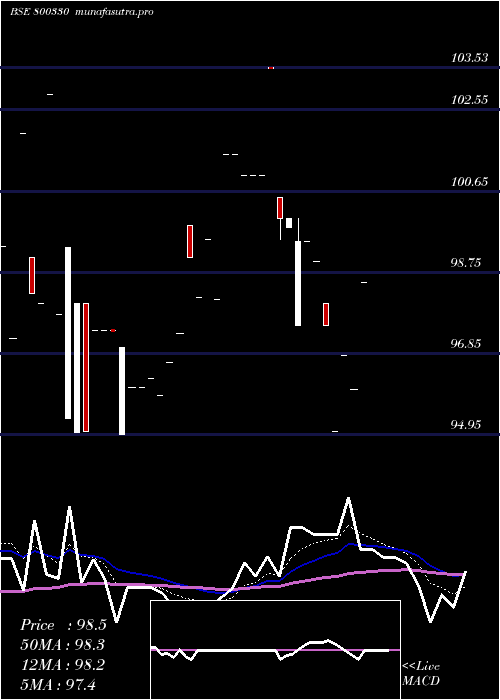
Daily price and charts and targets 667goi2050 Strong Daily Stock price targets for 667goi2050 800330 are 97.75 and 97.75 | Daily Target 1 | 97.75 | | Daily Target 2 | 97.75 | | Daily Target 3 | 97.75 | | Daily Target 4 | 97.75 | | Daily Target 5 | 97.75 |
Daily price and volume 667goi2050
| Date |
Closing |
Open |
Range |
Volume |
Thu 23 October 2025 |
97.75 (-1.3%) |
97.75 |
97.75 - 97.75 |
0.0002 times |
Mon 20 October 2025 |
99.04 (3.33%) |
99.04 |
99.04 - 99.04 |
0.0002 times |
Tue 14 October 2025 |
95.85 (-0.67%) |
96.49 |
95.85 - 96.49 |
0.0032 times |
Mon 13 October 2025 |
96.50 (1.05%) |
96.50 |
96.50 - 96.50 |
0.002 times |
Thu 09 October 2025 |
95.50 (-0.93%) |
95.70 |
95.50 - 95.70 |
3.4249 times |
Wed 08 October 2025 |
96.40 (0.41%) |
96.40 |
96.40 - 96.40 |
0.0391 times |
Mon 06 October 2025 |
96.01 (-0.5%) |
95.28 |
95.28 - 96.01 |
1.4725 times |
Wed 01 October 2025 |
96.49 (1.57%) |
96.49 |
96.49 - 96.49 |
5.0367 times |
Fri 12 September 2025 |
95.00 (0%) |
95.00 |
95.00 - 95.00 |
0.0201 times |
Fri 05 September 2025 |
95.00 (1.06%) |
95.00 |
95.00 - 95.00 |
0.001 times |
Tue 02 September 2025 |
94.00 (-1.52%) |
94.00 |
94.00 - 94.00 |
10.0733 times |
Weekly price and charts 667goi2050 Strong weekly Stock price targets for 667goi2050 800330 are 97.11 and 98.4 | Weekly Target 1 | 96.89 | | Weekly Target 2 | 97.32 | | Weekly Target 3 | 98.18 | | Weekly Target 4 | 98.61 | | Weekly Target 5 | 99.47 |
Weekly price and volumes for 667goi2050
| Date |
Closing |
Open |
Range |
Volume |
Thu 23 October 2025 |
97.75 (1.98%) |
99.04 |
97.75 - 99.04 |
0.0001 times |
Tue 14 October 2025 |
95.85 (0.37%) |
96.50 |
95.85 - 96.50 |
0.0017 times |
Thu 09 October 2025 |
95.50 (-1.03%) |
95.28 |
95.28 - 96.40 |
1.5929 times |
Wed 01 October 2025 |
96.49 (1.57%) |
96.49 |
96.49 - 96.49 |
1.6252 times |
Fri 12 September 2025 |
95.00 (0%) |
95.00 |
95.00 - 95.00 |
0.0065 times |
Fri 05 September 2025 |
95.00 (-0.47%) |
94.00 |
94.00 - 95.00 |
3.2507 times |
Thu 21 August 2025 |
95.45 (-2.5%) |
95.45 |
95.45 - 95.45 |
0.0001 times |
Thu 14 August 2025 |
97.90 (-0.61%) |
96.06 |
96.00 - 98.10 |
2.7096 times |
Fri 11 July 2025 |
98.50 (3.66%) |
96.80 |
96.00 - 98.50 |
0.7997 times |
Thu 03 July 2025 |
95.02 (-4.02%) |
98.00 |
95.02 - 98.00 |
0.0135 times |
Tue 17 June 2025 |
99.00 (-0.45%) |
99.45 |
99.00 - 99.45 |
0.0416 times |
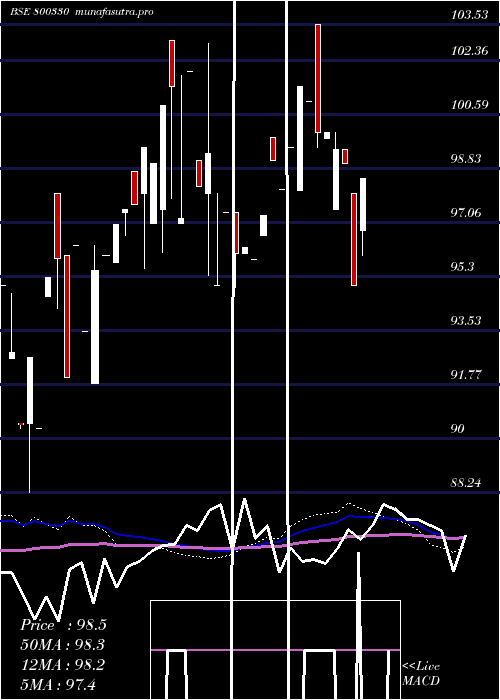
Monthly price and charts 667goi2050 Strong monthly Stock price targets for 667goi2050 800330 are 96.52 and 100.28 | Monthly Target 1 | 93.6 | | Monthly Target 2 | 95.67 | | Monthly Target 3 | 97.356666666667 | | Monthly Target 4 | 99.43 | | Monthly Target 5 | 101.12 |
Monthly price and volumes 667goi2050
| Date |
Closing |
Open |
Range |
Volume |
Thu 23 October 2025 |
97.75 (2.89%) |
96.49 |
95.28 - 99.04 |
2.6095 times |
Fri 12 September 2025 |
95.00 (-0.47%) |
94.00 |
94.00 - 95.00 |
2.6397 times |
Thu 21 August 2025 |
95.45 (-3.1%) |
96.06 |
95.45 - 98.10 |
2.196 times |
Fri 11 July 2025 |
98.50 (1.03%) |
95.02 |
95.02 - 98.50 |
0.6482 times |
Mon 23 June 2025 |
97.50 (-2.51%) |
99.80 |
97.50 - 100.00 |
0.0559 times |
Thu 29 May 2025 |
100.01 (0.51%) |
98.10 |
98.10 - 103.53 |
0.0488 times |
Wed 30 April 2025 |
99.50 (2.26%) |
99.84 |
98.16 - 99.84 |
0.0747 times |
Fri 21 March 2025 |
97.30 (1.09%) |
95.86 |
95.86 - 97.30 |
1.37 times |
Tue 18 February 2025 |
96.25 (0.21%) |
96.05 |
96.05 - 96.25 |
0.0822 times |
Thu 30 January 2025 |
96.05 (1.09%) |
97.39 |
94.95 - 97.39 |
0.2751 times |
Tue 24 December 2024 |
95.01 (-3.3%) |
98.00 |
95.00 - 102.90 |
0.1141 times |
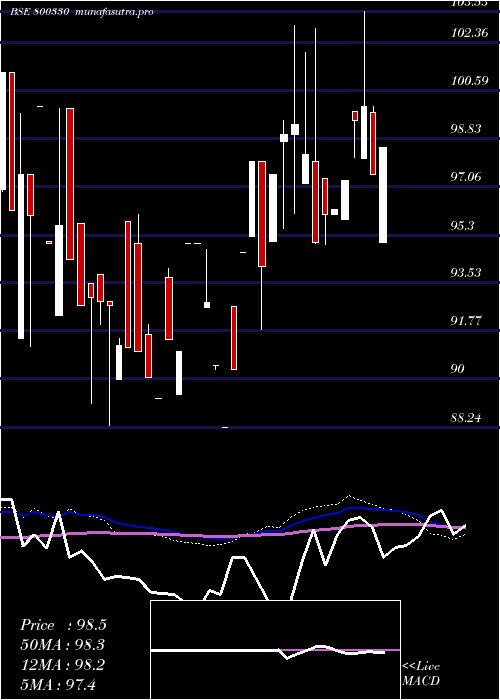
DMA SMA EMA moving averages of 667goi2050 800330
DMA (daily moving average) of 667goi2050 800330
| DMA period | DMA value | | 5 day DMA | 96.93 | | 12 day DMA | 96.08 | | 20 day DMA | 96.34 | | 35 day DMA | 97.97 | | 50 day DMA | 97.79 | | 100 day DMA | 97.15 | | 150 day DMA | 95.88 | | 200 day DMA | | EMA (exponential moving average) of 667goi2050 800330
| EMA period | EMA current | EMA prev | EMA prev2 | | 5 day EMA | 97.25 | 97 | 95.98 | | 12 day EMA | 96.77 | 96.59 | 96.15 | | 20 day EMA | 96.91 | 96.82 | 96.59 | | 35 day EMA | 97.16 | 97.13 | 97.02 | | 50 day EMA | 97.81 | 97.81 | 97.76 |
SMA (simple moving average) of 667goi2050 800330
| SMA period | SMA current | SMA prev | SMA prev2 | | 5 day SMA | 96.93 | 96.66 | 96.05 | | 12 day SMA | 96.08 | 96.1 | 95.84 | | 20 day SMA | 96.34 | 96.4 | 96.42 | | 35 day SMA | 97.97 | 97.96 | 97.89 | | 50 day SMA | 97.79 | 97.79 | 97.78 | | 100 day SMA | 97.15 | 97.12 | 97.08 | | 150 day SMA | 95.88 | 95.87 | 95.87 | | 200 day SMA |
|
|
