Sgbdec26 800290 full analysis,charts,indicators,moving averages,SMA,DMA,EMA,ADX,MACD,RSISgbdec26 800290 WideScreen charts, DMA,SMA,EMA technical analysis, forecast prediction, by indicators ADX,MACD,RSI,CCI BSE stock exchange
Daily price and charts and targets Sgbdec26 Strong Daily Stock price targets for Sgbdec26 800290 are 13326.02 and 13326.02 | Daily Target 1 | 13326.02 | | Daily Target 2 | 13326.02 | | Daily Target 3 | 13326.02 | | Daily Target 4 | 13326.02 | | Daily Target 5 | 13326.02 |
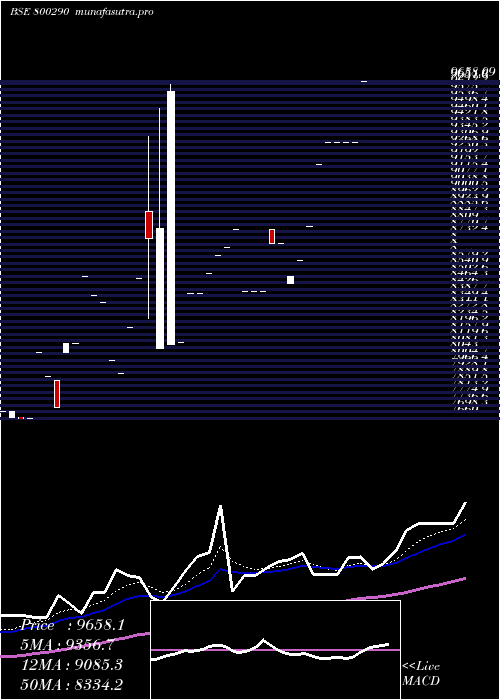
Daily price and volume Sgbdec26
| Date |
Closing |
Open |
Range |
Volume |
Mon 20 October 2025 |
13326.02 (2.5%) |
13326.02 |
13326.02 - 13326.02 |
0.4878 times |
Fri 17 October 2025 |
13001.00 (2.63%) |
13001.00 |
13001.00 - 13001.00 |
0.2439 times |
Mon 06 October 2025 |
12667.28 (4.52%) |
12667.28 |
12667.28 - 12667.28 |
0.2439 times |
Wed 24 September 2025 |
12120.00 (0%) |
12120.00 |
12120.00 - 12120.00 |
0.4878 times |
Tue 23 September 2025 |
12120.00 (-0.66%) |
12120.00 |
12120.00 - 12120.00 |
0.7317 times |
Thu 18 September 2025 |
12200.00 (1.15%) |
12200.00 |
12200.00 - 12200.00 |
0.7317 times |
Wed 17 September 2025 |
12061.00 (-3.51%) |
12061.00 |
12061.00 - 12061.00 |
0.4878 times |
Mon 15 September 2025 |
12500.00 (9.65%) |
11550.00 |
11550.00 - 12500.00 |
6.0976 times |
Fri 12 September 2025 |
11400.00 (0%) |
11400.00 |
11400.00 - 11400.00 |
0.2439 times |
Wed 10 September 2025 |
11400.00 (-0.44%) |
11400.00 |
11400.00 - 11400.00 |
0.2439 times |
Wed 03 September 2025 |
11450.00 (0%) |
11450.00 |
11450.00 - 11450.00 |
0.7317 times |
Weekly price and charts Sgbdec26 Strong weekly Stock price targets for Sgbdec26 800290 are 13326.02 and 13326.02 | Weekly Target 1 | 13326.02 | | Weekly Target 2 | 13326.02 | | Weekly Target 3 | 13326.02 | | Weekly Target 4 | 13326.02 | | Weekly Target 5 | 13326.02 |
Weekly price and volumes for Sgbdec26
| Date |
Closing |
Open |
Range |
Volume |
Mon 20 October 2025 |
13326.02 (2.5%) |
13326.02 |
13326.02 - 13326.02 |
0.1316 times |
Fri 17 October 2025 |
13001.00 (7.27%) |
12667.28 |
12667.28 - 13001.00 |
0.1316 times |
Wed 24 September 2025 |
12120.00 (-0.66%) |
12120.00 |
12120.00 - 12120.00 |
0.3289 times |
Thu 18 September 2025 |
12200.00 (7.02%) |
11550.00 |
11550.00 - 12500.00 |
1.9737 times |
Fri 12 September 2025 |
11400.00 (-0.44%) |
11400.00 |
11400.00 - 11400.00 |
0.1316 times |
Wed 03 September 2025 |
11450.00 (5.69%) |
10833.45 |
10833.45 - 11700.00 |
4.4079 times |
Fri 29 August 2025 |
10833.45 (5.42%) |
10276.50 |
10276.50 - 10833.45 |
1.5789 times |
Thu 14 August 2025 |
10276.50 (0.75%) |
10300.00 |
10200.00 - 10300.00 |
0.7895 times |
Fri 08 August 2025 |
10200.00 (5.15%) |
9651.50 |
9651.50 - 10201.64 |
0.3947 times |
Fri 11 July 2025 |
9700.00 (-0.61%) |
9759.88 |
9700.00 - 9759.88 |
0.1316 times |
Tue 01 July 2025 |
9759.88 (-1.42%) |
9526.00 |
9526.00 - 9759.88 |
0.1974 times |

Monthly price and charts Sgbdec26 Strong monthly Stock price targets for Sgbdec26 800290 are 12996.65 and 13655.39 | Monthly Target 1 | 12447.7 | | Monthly Target 2 | 12886.86 | | Monthly Target 3 | 13106.44 | | Monthly Target 4 | 13545.6 | | Monthly Target 5 | 13765.18 |
Monthly price and volumes Sgbdec26
| Date |
Closing |
Open |
Range |
Volume |
Mon 20 October 2025 |
13326.02 (9.95%) |
12667.28 |
12667.28 - 13326.02 |
0.099 times |
Wed 24 September 2025 |
12120.00 (11.88%) |
10833.45 |
10833.45 - 12500.00 |
2.5743 times |
Fri 29 August 2025 |
10833.45 (9.6%) |
10120.01 |
10120.01 - 10833.45 |
0.9653 times |
Tue 29 July 2025 |
9884.38 (3.76%) |
9526.00 |
9526.00 - 9884.38 |
0.1733 times |
Mon 30 June 2025 |
9526.00 (2.21%) |
9400.00 |
9351.00 - 10000.00 |
0.5693 times |
Fri 23 May 2025 |
9320.00 (-3.5%) |
9350.00 |
9050.00 - 9350.00 |
0.7921 times |
Wed 30 April 2025 |
9658.09 (11.01%) |
8460.00 |
8460.00 - 9658.09 |
3.0446 times |
Wed 26 March 2025 |
8700.00 (3.44%) |
8411.00 |
8411.00 - 8779.78 |
0.3218 times |
Fri 28 February 2025 |
8411.00 (-4.2%) |
8411.00 |
8411.00 - 8411.00 |
0.0248 times |
Thu 30 January 2025 |
8780.00 (8.25%) |
8398.00 |
8398.00 - 8780.00 |
1.4356 times |
Tue 31 December 2024 |
8111.10 (-2.86%) |
8000.00 |
7926.00 - 9640.00 |
14.5545 times |

DMA SMA EMA moving averages of Sgbdec26 800290
DMA (daily moving average) of Sgbdec26 800290
| DMA period | DMA value | | 5 day DMA | 12646.86 | | 12 day DMA | 12141.28 | | 20 day DMA | 11481.51 | | 35 day DMA | 10688.04 | | 50 day DMA | 10148.37 | | 100 day DMA | 8979.79 | | 150 day DMA | 8013.03 | | 200 day DMA | 7226.69 | EMA (exponential moving average) of Sgbdec26 800290
| EMA period | EMA current | EMA prev | EMA prev2 | | 5 day EMA | 12774.92 | 12499.41 | 12248.65 | | 12 day EMA | 12174.24 | 11964.9 | 11776.58 | | 20 day EMA | 11657.72 | 11482.19 | 11322.39 | | 35 day EMA | 10946.14 | 10806.03 | 10676.81 | | 50 day EMA | 10268.37 | 10143.62 | 10027.04 |
SMA (simple moving average) of Sgbdec26 800290
| SMA period | SMA current | SMA prev | SMA prev2 | | 5 day SMA | 12646.86 | 12421.66 | 12233.66 | | 12 day SMA | 12141.28 | 11949.52 | 11768.89 | | 20 day SMA | 11481.51 | 11325.21 | 11169.38 | | 35 day SMA | 10688.04 | 10583.24 | 10477.5 | | 50 day SMA | 10148.37 | 10055.35 | 9967.87 | | 100 day SMA | 8979.79 | 8917.05 | 8860.54 | | 150 day SMA | 8013.03 | 7957.93 | 7903.53 | | 200 day SMA | 7226.69 | 7183.12 | 7143.12 |
|
|
