795goi2032 800220 full analysis,charts,indicators,moving averages,SMA,DMA,EMA,ADX,MACD,RSI795goi2032 800220 WideScreen charts, DMA,SMA,EMA technical analysis, forecast prediction, by indicators ADX,MACD,RSI,CCI BSE stock exchange
Daily price and charts and targets 795goi2032 Strong Daily Stock price targets for 795goi2032 800220 are 107.55 and 107.55 | Daily Target 1 | 107.55 | | Daily Target 2 | 107.55 | | Daily Target 3 | 107.55 | | Daily Target 4 | 107.55 | | Daily Target 5 | 107.55 |
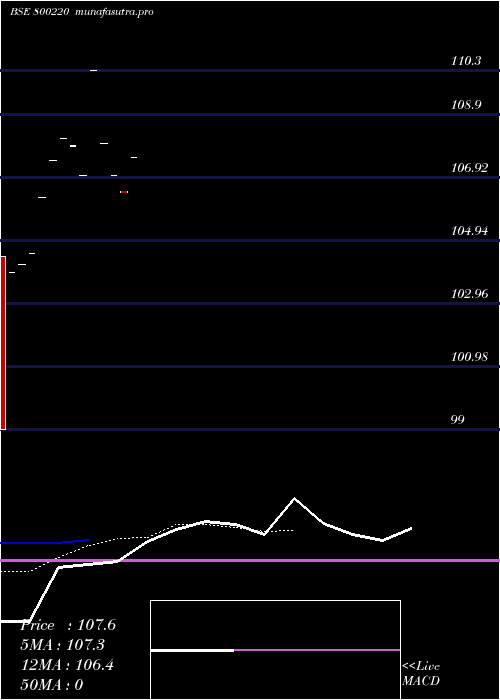
Daily price and volume 795goi2032
| Date |
Closing |
Open |
Range |
Volume |
Fri 05 December 2025 |
107.55 (1.03%) |
107.55 |
107.55 - 107.55 |
0.0008 times |
Thu 06 November 2025 |
106.45 (-0.51%) |
106.50 |
106.45 - 106.50 |
1.5819 times |
Wed 03 September 2025 |
107.00 (-0.93%) |
107.00 |
107.00 - 107.00 |
0.0475 times |
Mon 01 September 2025 |
108.00 (-2.09%) |
108.00 |
108.00 - 108.00 |
0.5726 times |
Thu 03 July 2025 |
110.30 (3.08%) |
110.30 |
110.30 - 110.30 |
0.0791 times |
Wed 25 June 2025 |
107.00 (-0.88%) |
107.00 |
107.00 - 107.00 |
2.3729 times |
Tue 29 April 2025 |
107.95 (-0.18%) |
107.90 |
107.90 - 107.95 |
0.0016 times |
Fri 21 February 2025 |
108.15 (0.65%) |
108.15 |
108.15 - 108.15 |
0.3607 times |
Thu 26 December 2024 |
107.45 (1.08%) |
107.45 |
107.45 - 107.45 |
4.548 times |
Wed 13 November 2024 |
106.30 (1.67%) |
106.30 |
106.30 - 106.30 |
0.435 times |
Mon 02 September 2024 |
104.55 (0.34%) |
104.55 |
104.55 - 104.55 |
0.0079 times |
Weekly price and charts 795goi2032 Strong weekly Stock price targets for 795goi2032 800220 are 106.23 and 107.78 | Weekly Target 1 | 105.78 | | Weekly Target 2 | 106.67 | | Weekly Target 3 | 107.33333333333 | | Weekly Target 4 | 108.22 | | Weekly Target 5 | 108.88 |
Weekly price and volumes for 795goi2032
| Date |
Closing |
Open |
Range |
Volume |
Fri 05 December 2025 |
107.55 (-2.49%) |
108.00 |
106.45 - 108.00 |
0.9838 times |
Thu 03 July 2025 |
110.30 (1.99%) |
107.90 |
107.00 - 110.30 |
1.0958 times |
Fri 21 February 2025 |
108.15 (3.79%) |
104.55 |
104.55 - 108.15 |
2.3901 times |
Mon 26 August 2024 |
104.20 (0.24%) |
104.20 |
104.20 - 104.20 |
0.5299 times |
Mon 15 July 2024 |
103.95 (0%) |
103.95 |
103.95 - 103.95 |
0.0004 times |
Sun 07 December 2025 |
(0%) |
|
- |
0 times |

Monthly price and charts 795goi2032 Strong monthly Stock price targets for 795goi2032 800220 are 107.55 and 107.55 | Monthly Target 1 | 107.55 | | Monthly Target 2 | 107.55 | | Monthly Target 3 | 107.55 | | Monthly Target 4 | 107.55 | | Monthly Target 5 | 107.55 |
Monthly price and volumes 795goi2032
| Date |
Closing |
Open |
Range |
Volume |
Fri 05 December 2025 |
107.55 (1.03%) |
107.55 |
107.55 - 107.55 |
0.0008 times |
Thu 06 November 2025 |
106.45 (-0.51%) |
106.50 |
106.45 - 106.50 |
1.5807 times |
Wed 03 September 2025 |
107.00 (-2.99%) |
108.00 |
107.00 - 108.00 |
0.6196 times |
Thu 03 July 2025 |
110.30 (3.08%) |
110.30 |
110.30 - 110.30 |
0.079 times |
Wed 25 June 2025 |
107.00 (-0.88%) |
107.00 |
107.00 - 107.00 |
2.371 times |
Tue 29 April 2025 |
107.95 (-0.18%) |
107.90 |
107.90 - 107.95 |
0.0016 times |
Fri 21 February 2025 |
108.15 (0.65%) |
108.15 |
108.15 - 108.15 |
0.3604 times |
Thu 26 December 2024 |
107.45 (1.08%) |
107.45 |
107.45 - 107.45 |
4.5444 times |
Wed 13 November 2024 |
106.30 (1.67%) |
106.30 |
106.30 - 106.30 |
0.4347 times |
Mon 02 September 2024 |
104.55 (0.34%) |
104.55 |
104.55 - 104.55 |
0.0079 times |
Mon 26 August 2024 |
104.20 (0.24%) |
104.20 |
104.20 - 104.20 |
1.1855 times |

DMA SMA EMA moving averages of 795goi2032 800220
DMA (daily moving average) of 795goi2032 800220
| DMA period | DMA value | | 5 day DMA | 107.86 | | 12 day DMA | 107.08 | | 20 day DMA | | | 35 day DMA | | | 50 day DMA | | | 100 day DMA | | | 150 day DMA | | | 200 day DMA | | EMA (exponential moving average) of 795goi2032 800220
| EMA period | EMA current | EMA prev | EMA prev2 | | 5 day EMA | 107.34 | 107.24 | 107.63 | | 12 day EMA | 106.41 | 106.2 | 106.15 | | 20 day EMA | 0 | 0 | 0 | | 35 day EMA | 0 | 0 | 0 | | 50 day EMA | 0 | 0 | 0 |
SMA (simple moving average) of 795goi2032 800220
| SMA period | SMA current | SMA prev | SMA prev2 | | 5 day SMA | 107.86 | 107.75 | 108.05 | | 12 day SMA | 107.08 | | 20 day SMA | | 35 day SMA | | 50 day SMA | | 100 day SMA | | 150 day SMA | | 200 day SMA |
|
|
