QuantumIndx 590110 full analysis,charts,indicators,moving averages,SMA,DMA,EMA,ADX,MACD,RSIQuantum Indx 590110 WideScreen charts, DMA,SMA,EMA technical analysis, forecast prediction, by indicators ADX,MACD,RSI,CCI BSE stock exchange
Daily price and charts and targets QuantumIndx Strong Daily Stock price targets for QuantumIndx 590110 are 2853.84 and 2876.17 | Daily Target 1 | 2835.23 | | Daily Target 2 | 2850.11 | | Daily Target 3 | 2857.5566666667 | | Daily Target 4 | 2872.44 | | Daily Target 5 | 2879.89 |
Daily price and volume Quantum Indx
| Date |
Closing |
Open |
Range |
Volume |
Fri 05 December 2025 |
2865.00 (0.54%) |
2848.00 |
2842.67 - 2865.00 |
2.8324 times |
Thu 04 December 2025 |
2849.50 (0.33%) |
2850.00 |
2844.00 - 2850.00 |
0.8092 times |
Wed 03 December 2025 |
2840.25 (-0.25%) |
2836.00 |
2835.00 - 2841.49 |
1.0983 times |
Tue 02 December 2025 |
2847.49 (-0.52%) |
2850.00 |
2847.49 - 2852.92 |
1.0405 times |
Mon 01 December 2025 |
2862.51 (-0.19%) |
2861.50 |
2861.50 - 2863.51 |
0.2312 times |
Fri 28 November 2025 |
2868.00 (0%) |
2868.00 |
2868.00 - 2874.00 |
0.578 times |
Thu 27 November 2025 |
2867.96 (0.21%) |
2862.00 |
2862.00 - 2868.00 |
0.7514 times |
Wed 26 November 2025 |
2862.00 (1%) |
2862.00 |
2862.00 - 2862.00 |
0.289 times |
Tue 25 November 2025 |
2833.67 (-0.52%) |
2834.48 |
2832.06 - 2834.48 |
0.3468 times |
Mon 24 November 2025 |
2848.62 (-0.33%) |
2854.00 |
2848.62 - 2854.00 |
2.0231 times |
Fri 21 November 2025 |
2858.00 (-0.21%) |
2860.00 |
2858.00 - 2860.00 |
0.578 times |
Weekly price and charts QuantumIndx Strong weekly Stock price targets for QuantumIndx 590110 are 2850 and 2880 | Weekly Target 1 | 2825 | | Weekly Target 2 | 2845 | | Weekly Target 3 | 2855 | | Weekly Target 4 | 2875 | | Weekly Target 5 | 2885 |
Weekly price and volumes for Quantum Indx
| Date |
Closing |
Open |
Range |
Volume |
Fri 05 December 2025 |
2865.00 (-0.1%) |
2861.50 |
2835.00 - 2865.00 |
1.0277 times |
Fri 28 November 2025 |
2868.00 (0.35%) |
2854.00 |
2832.06 - 2874.00 |
0.6818 times |
Fri 21 November 2025 |
2858.00 (1.42%) |
2836.00 |
2831.75 - 2866.00 |
1.1957 times |
Fri 14 November 2025 |
2818.00 (1.05%) |
2796.00 |
2796.00 - 2838.00 |
0.6324 times |
Fri 07 November 2025 |
2788.80 (-0.75%) |
2806.00 |
2770.00 - 2818.00 |
1.0968 times |
Fri 31 October 2025 |
2810.00 (-1.26%) |
2832.00 |
2810.00 - 2838.52 |
0.5632 times |
Thu 23 October 2025 |
2846.00 (1.39%) |
2820.00 |
2820.00 - 2846.00 |
0.4447 times |
Fri 17 October 2025 |
2807.00 (1.56%) |
2750.00 |
2722.50 - 2808.00 |
0.998 times |
Fri 10 October 2025 |
2764.00 (1.69%) |
2726.00 |
2726.00 - 2764.00 |
2.0059 times |
Fri 03 October 2025 |
2718.00 (0.89%) |
2696.00 |
2690.00 - 2718.00 |
1.3538 times |
Fri 26 September 2025 |
2694.00 (-2.74%) |
2764.01 |
2694.00 - 2766.42 |
2.4605 times |
Monthly price and charts QuantumIndx Strong monthly Stock price targets for QuantumIndx 590110 are 2850 and 2880 | Monthly Target 1 | 2825 | | Monthly Target 2 | 2845 | | Monthly Target 3 | 2855 | | Monthly Target 4 | 2875 | | Monthly Target 5 | 2885 |
Monthly price and volumes Quantum Indx
| Date |
Closing |
Open |
Range |
Volume |
Fri 05 December 2025 |
2865.00 (-0.1%) |
2861.50 |
2835.00 - 2865.00 |
0.0899 times |
Fri 28 November 2025 |
2868.00 (2.06%) |
2806.00 |
2770.00 - 2874.00 |
0.3157 times |
Fri 31 October 2025 |
2810.00 (4.44%) |
2706.00 |
2704.00 - 2846.00 |
0.422 times |
Tue 30 September 2025 |
2690.50 (0.13%) |
2670.00 |
2670.00 - 2770.00 |
0.8423 times |
Fri 29 August 2025 |
2686.92 (-0.59%) |
2692.00 |
2660.00 - 2748.00 |
0.5786 times |
Thu 31 July 2025 |
2703.00 (-2.54%) |
2782.00 |
2686.00 - 2782.00 |
1.356 times |
Mon 30 June 2025 |
2773.38 (3.25%) |
2678.00 |
2666.00 - 2788.00 |
0.9894 times |
Fri 30 May 2025 |
2686.00 (2.19%) |
2644.00 |
2602.00 - 2725.00 |
0.8605 times |
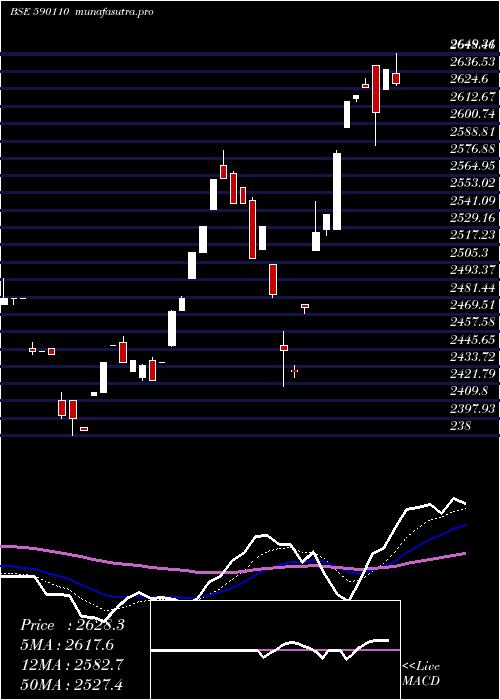
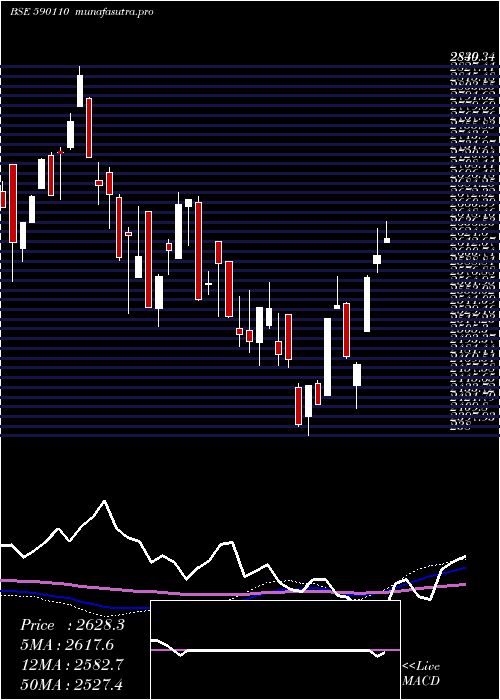
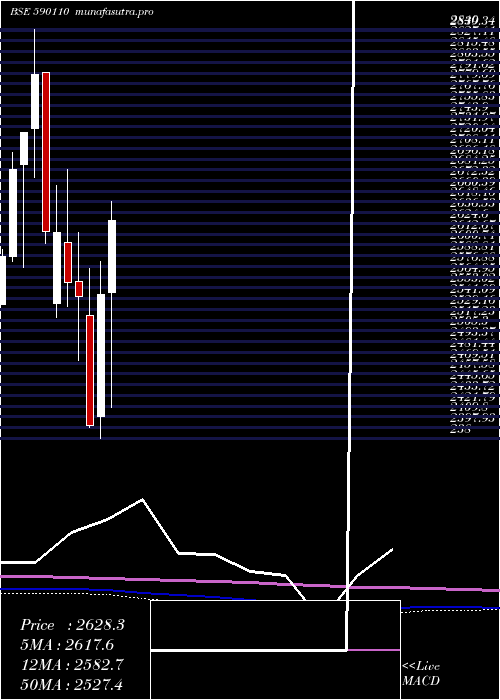
Tue 29 April 2025 |
2628.31 (3.23%) |
2548.00 |
2420.00 - 2649.31 |
2.8505 times |
Fri 28 March 2025 |
2546.00 (6.08%) |
2410.00 |
2386.00 - 2582.00 |
1.6951 times |
Fri 28 February 2025 |
2400.00 (-5.66%) |
2522.00 |
2398.00 - 2574.00 |
1.574 times |
DMA SMA EMA moving averages of Quantum Indx 590110
DMA (daily moving average) of Quantum Indx 590110
| DMA period | DMA value | | 5 day DMA | 2852.95 | | 12 day DMA | 2855.58 | | 20 day DMA | 2840.38 | | 35 day DMA | 2822.35 | | 50 day DMA | 2795.77 | | 100 day DMA | 2760.37 | | 150 day DMA | 2720.68 | | 200 day DMA | 2662.6 | EMA (exponential moving average) of Quantum Indx 590110
| EMA period | EMA current | EMA prev | EMA prev2 | | 5 day EMA | 2855.26 | 2850.39 | 2850.84 | | 12 day EMA | 2850.07 | 2847.36 | 2846.97 | | 20 day EMA | 2840.56 | 2837.99 | 2836.78 | | 35 day EMA | 2818.53 | 2815.79 | 2813.81 | | 50 day EMA | 2795.8 | 2792.98 | 2790.67 |
SMA (simple moving average) of Quantum Indx 590110
| SMA period | SMA current | SMA prev | SMA prev2 | | 5 day SMA | 2852.95 | 2853.55 | 2857.24 | | 12 day SMA | 2855.58 | 2852.81 | 2851.52 | | 20 day SMA | 2840.38 | 2836.68 | 2833.9 | | 35 day SMA | 2822.35 | 2818.95 | 2815.71 | | 50 day SMA | 2795.77 | 2793.29 | 2790.9 | | 100 day SMA | 2760.37 | 2758.84 | 2757.29 | | 150 day SMA | 2720.68 | 2718.55 | 2716.64 | | 200 day SMA | 2662.6 | 2660.75 | 2659.17 |
|
|
