OrissaMine 590086 full analysis,charts,indicators,moving averages,SMA,DMA,EMA,ADX,MACD,RSIOrissa Mine 590086 WideScreen charts, DMA,SMA,EMA technical analysis, forecast prediction, by indicators ADX,MACD,RSI,CCI BSE stock exchange
Daily price and charts and targets OrissaMine Strong Daily Stock price targets for OrissaMine 590086 are 5201.3 and 5346.6 | Daily Target 1 | 5173.7 | | Daily Target 2 | 5228.9 | | Daily Target 3 | 5319 | | Daily Target 4 | 5374.2 | | Daily Target 5 | 5464.3 |
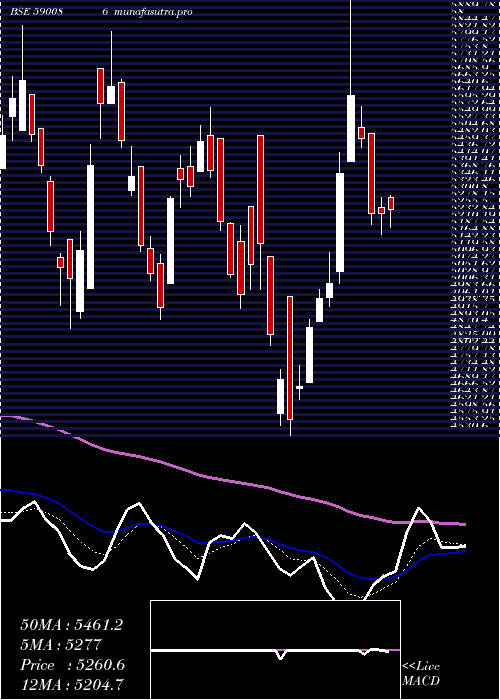
Daily price and volume Orissa Mine
| Date |
Closing |
Open |
Range |
Volume |
Thu 23 October 2025 |
5284.10 (-1.82%) |
5409.10 |
5263.80 - 5409.10 |
0.5406 times |
Tue 21 October 2025 |
5382.20 (1.2%) |
5385.65 |
5371.70 - 5418.95 |
0.1336 times |
Mon 20 October 2025 |
5318.30 (0.93%) |
5289.90 |
5215.70 - 5379.70 |
0.6207 times |
Fri 17 October 2025 |
5269.45 (-0.41%) |
5314.75 |
5232.00 - 5332.40 |
0.4764 times |
Thu 16 October 2025 |
5291.25 (-1.56%) |
5390.55 |
5275.00 - 5405.80 |
0.488 times |
Wed 15 October 2025 |
5375.30 (1.33%) |
5301.05 |
5268.90 - 5484.45 |
1.9263 times |
Tue 14 October 2025 |
5304.65 (-2.15%) |
5463.90 |
5272.00 - 5602.50 |
1.2272 times |
Mon 13 October 2025 |
5421.40 (-2.81%) |
5568.95 |
5388.60 - 5568.95 |
1.1862 times |
Fri 10 October 2025 |
5577.95 (-0.76%) |
5680.00 |
5555.00 - 5766.70 |
1.6992 times |
Thu 09 October 2025 |
5620.75 (-0.57%) |
5637.20 |
5564.80 - 5769.35 |
1.7018 times |
Wed 08 October 2025 |
5653.15 (0.11%) |
5606.65 |
5574.00 - 5800.00 |
3.9656 times |
Weekly price and charts OrissaMine Strong weekly Stock price targets for OrissaMine 590086 are 5148.28 and 5351.53 | Weekly Target 1 | 5103 | | Weekly Target 2 | 5193.55 | | Weekly Target 3 | 5306.25 | | Weekly Target 4 | 5396.8 | | Weekly Target 5 | 5509.5 |
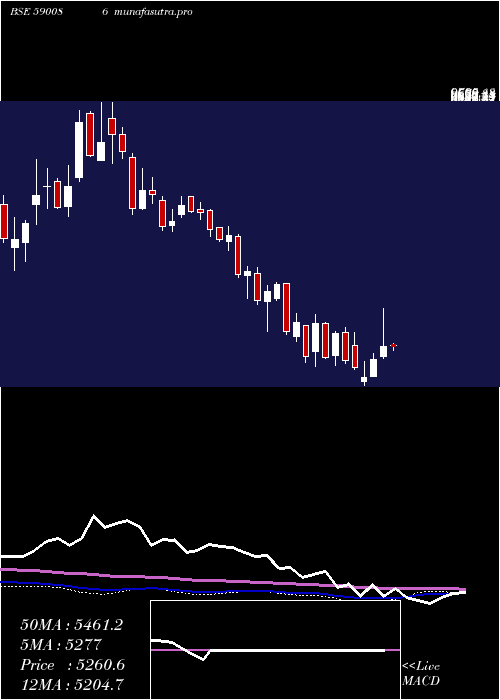
Weekly price and volumes for Orissa Mine
| Date |
Closing |
Open |
Range |
Volume |
Thu 23 October 2025 |
5284.10 (0.28%) |
5289.90 |
5215.70 - 5418.95 |
0.1433 times |
Fri 17 October 2025 |
5269.45 (-5.53%) |
5568.95 |
5232.00 - 5602.50 |
0.587 times |
Fri 10 October 2025 |
5577.95 (-1.86%) |
5715.00 |
5555.00 - 6132.00 |
3.1058 times |
Fri 03 October 2025 |
5683.50 (18.09%) |
4844.40 |
4617.95 - 5706.10 |
3.356 times |
Fri 26 September 2025 |
4812.85 (-1.09%) |
4899.15 |
4800.00 - 5241.65 |
1.0449 times |
Fri 19 September 2025 |
4865.65 (-2.01%) |
4999.00 |
4785.00 - 5036.20 |
0.239 times |
Fri 12 September 2025 |
4965.50 (2.86%) |
4875.00 |
4855.45 - 5065.00 |
0.4908 times |
Fri 05 September 2025 |
4827.30 (1.72%) |
4795.75 |
4653.00 - 5089.95 |
0.5029 times |
Fri 29 August 2025 |
4745.70 (-4.04%) |
4919.05 |
4720.05 - 5000.00 |
0.1615 times |
Fri 22 August 2025 |
4945.25 (1.88%) |
4897.65 |
4877.25 - 5256.00 |
0.3687 times |
Thu 14 August 2025 |
4854.00 (2.8%) |
4697.70 |
4690.05 - 5022.00 |
0.3067 times |
Monthly price and charts OrissaMine Strong monthly Stock price targets for OrissaMine 590086 are 4973.68 and 6442.43 | Monthly Target 1 | 3891.03 | | Monthly Target 2 | 4587.57 | | Monthly Target 3 | 5359.7833333333 | | Monthly Target 4 | 6056.32 | | Monthly Target 5 | 6828.53 |
Monthly price and volumes Orissa Mine
| Date |
Closing |
Open |
Range |
Volume |
Thu 23 October 2025 |
5284.10 (13.4%) |
4665.65 |
4663.25 - 6132.00 |
2.9797 times |
Tue 30 September 2025 |
4659.70 (-1.81%) |
4795.75 |
4617.95 - 5241.65 |
1.0162 times |
Fri 29 August 2025 |
4745.70 (-3.96%) |
4941.35 |
4602.00 - 5256.00 |
0.5407 times |
Thu 31 July 2025 |
4941.35 (0.15%) |
4944.50 |
4604.75 - 5414.35 |
1.3588 times |
Mon 30 June 2025 |
4934.15 (-3.63%) |
5017.35 |
4760.05 - 5375.00 |
0.9853 times |
Fri 30 May 2025 |
5119.90 (1.15%) |
5156.40 |
4848.50 - 5734.00 |
0.6003 times |
Wed 30 April 2025 |
5061.45 (1.55%) |
5270.95 |
4530.60 - 5940.00 |
0.6604 times |
Fri 28 March 2025 |
4984.15 (-1.72%) |
5163.80 |
4875.00 - 5835.00 |
0.7378 times |
Fri 28 February 2025 |
5071.20 (-18.83%) |
6131.80 |
4951.00 - 6423.45 |
0.5323 times |
Fri 31 January 2025 |
6247.80 (-12.02%) |
7432.95 |
5519.40 - 7432.95 |
0.5885 times |
Tue 31 December 2024 |
7101.10 (-9.12%) |
7989.95 |
7006.15 - 7989.95 |
0.3699 times |

DMA SMA EMA moving averages of Orissa Mine 590086
DMA (daily moving average) of Orissa Mine 590086
| DMA period | DMA value | | 5 day DMA | 5309.06 | | 12 day DMA | 5428.8 | | 20 day DMA | 5273.59 | | 35 day DMA | 5109.97 | | 50 day DMA | 5032.34 | | 100 day DMA | 4974.56 | | 150 day DMA | 5041.26 | | 200 day DMA | 5326.38 | EMA (exponential moving average) of Orissa Mine 590086
| EMA period | EMA current | EMA prev | EMA prev2 | | 5 day EMA | 5327.8 | 5349.65 | 5333.37 | | 12 day EMA | 5330.48 | 5338.91 | 5331.04 | | 20 day EMA | 5275.07 | 5274.12 | 5262.75 | | 35 day EMA | 5170.92 | 5164.26 | 5151.43 | | 50 day EMA | 5040.8 | 5030.87 | 5016.54 |
SMA (simple moving average) of Orissa Mine 590086
| SMA period | SMA current | SMA prev | SMA prev2 | | 5 day SMA | 5309.06 | 5327.3 | 5311.79 | | 12 day SMA | 5428.8 | 5471.86 | 5496.97 | | 20 day SMA | 5273.59 | 5266.25 | 5239.54 | | 35 day SMA | 5109.97 | 5096.89 | 5079.77 | | 50 day SMA | 5032.34 | 5021.09 | 5008.75 | | 100 day SMA | 4974.56 | 4971.31 | 4967.17 | | 150 day SMA | 5041.26 | 5043.39 | 5043.52 | | 200 day SMA | 5326.38 | 5336.21 | 5345.56 |
|
|
