XproIndi 590013 full analysis,charts,indicators,moving averages,SMA,DMA,EMA,ADX,MACD,RSIXpro Indi 590013 WideScreen charts, DMA,SMA,EMA technical analysis, forecast prediction, by indicators ADX,MACD,RSI,CCI BSE stock exchange
Daily price and charts and targets XproIndi Strong Daily Stock price targets for XproIndi 590013 are 1093.55 and 1113.55 | Daily Target 1 | 1077.37 | | Daily Target 2 | 1089.73 | | Daily Target 3 | 1097.3666666667 | | Daily Target 4 | 1109.73 | | Daily Target 5 | 1117.37 |
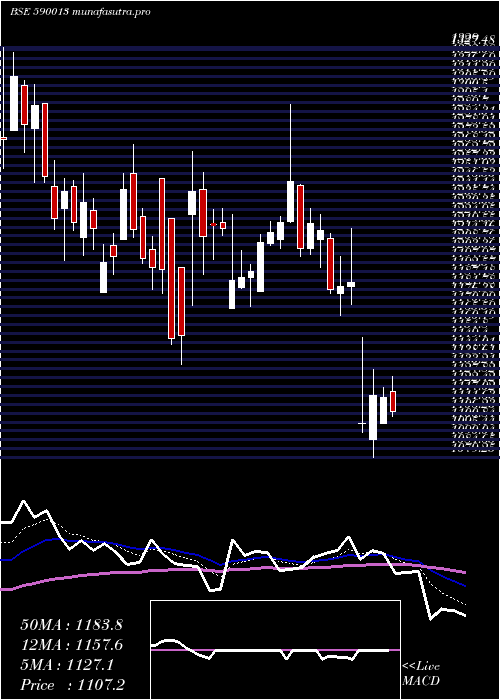
Daily price and volume Xpro Indi
| Date |
Closing |
Open |
Range |
Volume |
Tue 21 October 2025 |
1102.10 (1.82%) |
1099.95 |
1085.00 - 1105.00 |
0.2103 times |
Mon 20 October 2025 |
1082.45 (0.31%) |
1077.35 |
1074.30 - 1092.60 |
0.6537 times |
Fri 17 October 2025 |
1079.15 (-0.57%) |
1087.75 |
1065.00 - 1093.55 |
0.881 times |
Thu 16 October 2025 |
1085.35 (0.02%) |
1090.15 |
1073.00 - 1096.00 |
1.0096 times |
Wed 15 October 2025 |
1085.15 (-0.22%) |
1099.00 |
1083.10 - 1099.20 |
0.3786 times |
Tue 14 October 2025 |
1087.50 (-0.09%) |
1151.00 |
1085.80 - 1151.00 |
0.5655 times |
Mon 13 October 2025 |
1088.45 (-0.27%) |
1091.60 |
1080.75 - 1095.20 |
0.8147 times |
Fri 10 October 2025 |
1091.35 (-0.95%) |
1114.95 |
1066.00 - 1114.95 |
3.4285 times |
Thu 09 October 2025 |
1101.80 (-1.58%) |
1118.40 |
1099.70 - 1136.60 |
1.5686 times |
Wed 08 October 2025 |
1119.50 (-0.09%) |
1121.75 |
1111.45 - 1134.10 |
0.4894 times |
Tue 07 October 2025 |
1120.50 (-0.77%) |
1111.15 |
1111.15 - 1149.00 |
2.0605 times |
Weekly price and charts XproIndi Strong weekly Stock price targets for XproIndi 590013 are 1088.2 and 1118.9 | Weekly Target 1 | 1063.1 | | Weekly Target 2 | 1082.6 | | Weekly Target 3 | 1093.8 | | Weekly Target 4 | 1113.3 | | Weekly Target 5 | 1124.5 |
Weekly price and volumes for Xpro Indi
| Date |
Closing |
Open |
Range |
Volume |
Tue 21 October 2025 |
1102.10 (2.13%) |
1077.35 |
1074.30 - 1105.00 |
0.0869 times |
Fri 17 October 2025 |
1079.15 (-1.12%) |
1091.60 |
1065.00 - 1151.00 |
0.367 times |
Fri 10 October 2025 |
1091.35 (-3.68%) |
1173.90 |
1066.00 - 1173.90 |
0.9099 times |
Fri 03 October 2025 |
1133.10 (-0.81%) |
1131.00 |
1116.80 - 1165.40 |
0.5689 times |
Fri 26 September 2025 |
1142.35 (1.72%) |
1127.25 |
1127.25 - 1275.00 |
1.2569 times |
Fri 19 September 2025 |
1123.05 (-8.99%) |
1216.00 |
1114.80 - 1254.75 |
3.4003 times |
Fri 12 September 2025 |
1233.95 (0.6%) |
1202.15 |
1202.15 - 1295.50 |
0.8268 times |
Fri 05 September 2025 |
1226.60 (8.08%) |
1138.70 |
1122.95 - 1265.00 |
0.9882 times |
Fri 29 August 2025 |
1134.85 (1.74%) |
1114.00 |
1085.70 - 1162.80 |
1.3081 times |
Fri 22 August 2025 |
1115.40 (-1.14%) |
1127.30 |
1100.00 - 1141.20 |
0.2869 times |
Thu 14 August 2025 |
1128.25 (-0.04%) |
1128.75 |
1121.15 - 1183.25 |
0.3637 times |

Monthly price and charts XproIndi Strong monthly Stock price targets for XproIndi 590013 are 1029.1 and 1138 | Monthly Target 1 | 1004.77 | | Monthly Target 2 | 1053.43 | | Monthly Target 3 | 1113.6666666667 | | Monthly Target 4 | 1162.33 | | Monthly Target 5 | 1222.57 |
Monthly price and volumes Xpro Indi
| Date |
Closing |
Open |
Range |
Volume |
Tue 21 October 2025 |
1102.10 (-2.71%) |
1131.00 |
1065.00 - 1173.90 |
0.436 times |
Tue 30 September 2025 |
1132.85 (-0.18%) |
1138.70 |
1114.80 - 1295.50 |
1.7283 times |
Fri 29 August 2025 |
1134.85 (1.69%) |
1119.25 |
1085.70 - 1183.25 |
0.6974 times |
Thu 31 July 2025 |
1116.00 (-6.62%) |
1249.00 |
1079.25 - 1294.00 |
1.1845 times |
Mon 30 June 2025 |
1195.10 (0.3%) |
1180.05 |
1151.05 - 1329.00 |
1.3404 times |
Fri 30 May 2025 |
1191.55 (15.89%) |
1024.00 |
953.00 - 1271.00 |
0.9911 times |
Wed 30 April 2025 |
1028.20 (-11.94%) |
1161.10 |
1014.30 - 1215.40 |
0.4695 times |
Fri 28 March 2025 |
1167.65 (12.21%) |
1025.05 |
1017.30 - 1234.80 |
0.5427 times |
Fri 28 February 2025 |
1040.55 (-17.73%) |
1212.00 |
1006.00 - 1294.55 |
1.1134 times |
Fri 31 January 2025 |
1264.85 (-14.89%) |
1569.95 |
1140.35 - 1627.45 |
1.4967 times |
Tue 31 December 2024 |
1486.15 (0.88%) |
1450.70 |
1447.35 - 1675.55 |
1.3707 times |

DMA SMA EMA moving averages of Xpro Indi 590013
DMA (daily moving average) of Xpro Indi 590013
| DMA period | DMA value | | 5 day DMA | 1086.84 | | 12 day DMA | 1097.7 | | 20 day DMA | 1119.12 | | 35 day DMA | 1159.48 | | 50 day DMA | 1150.33 | | 100 day DMA | 1175.59 | | 150 day DMA | 1156.25 | | 200 day DMA | 1191.9 | EMA (exponential moving average) of Xpro Indi 590013
| EMA period | EMA current | EMA prev | EMA prev2 | | 5 day EMA | 1090.95 | 1085.37 | 1086.83 | | 12 day EMA | 1101.03 | 1100.83 | 1104.17 | | 20 day EMA | 1115.54 | 1116.95 | 1120.58 | | 35 day EMA | 1127.15 | 1128.63 | 1131.35 | | 50 day EMA | 1141.87 | 1143.49 | 1145.98 |
SMA (simple moving average) of Xpro Indi 590013
| SMA period | SMA current | SMA prev | SMA prev2 | | 5 day SMA | 1086.84 | 1083.92 | 1085.12 | | 12 day SMA | 1097.7 | 1100.29 | 1103.92 | | 20 day SMA | 1119.12 | 1124.67 | 1126.7 | | 35 day SMA | 1159.48 | 1161.8 | 1163.29 | | 50 day SMA | 1150.33 | 1150.76 | 1151.59 | | 100 day SMA | 1175.59 | 1176.37 | 1177.54 | | 150 day SMA | 1156.25 | 1156.51 | 1156.53 | | 200 day SMA | 1191.9 | 1194.08 | 1196.36 |
|
|
