GngElectronics 544455 full analysis,charts,indicators,moving averages,SMA,DMA,EMA,ADX,MACD,RSIGng Electronics 544455 WideScreen charts, DMA,SMA,EMA technical analysis, forecast prediction, by indicators ADX,MACD,RSI,CCI BSE stock exchange
Daily price and charts and targets GngElectronics Strong Daily Stock price targets for GngElectronics 544455 are 320.28 and 329.93 | Daily Target 1 | 318.63 | | Daily Target 2 | 321.92 | | Daily Target 3 | 328.28333333333 | | Daily Target 4 | 331.57 | | Daily Target 5 | 337.93 |
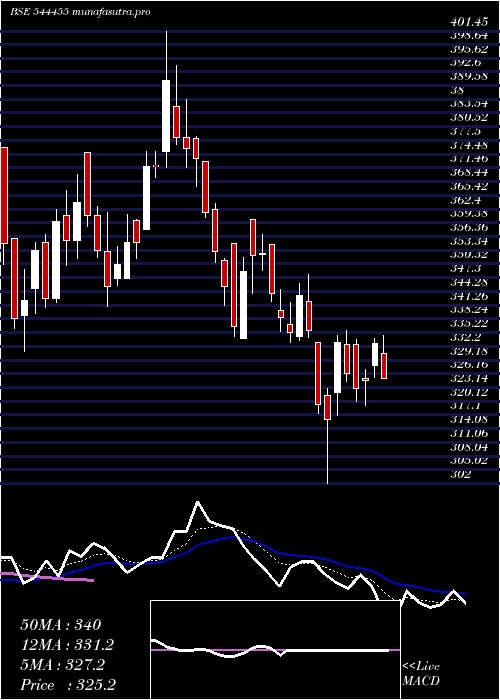
Daily price and volume Gng Electronics
| Date |
Closing |
Open |
Range |
Volume |
Thu 23 October 2025 |
325.20 (-2.28%) |
330.55 |
325.00 - 334.65 |
0.4747 times |
Tue 21 October 2025 |
332.80 (2.48%) |
328.00 |
325.35 - 334.00 |
0.7014 times |
Mon 20 October 2025 |
324.75 (0.57%) |
325.00 |
319.10 - 327.20 |
0.9876 times |
Fri 17 October 2025 |
322.90 (-0.98%) |
332.65 |
320.00 - 333.75 |
0.3753 times |
Thu 16 October 2025 |
326.10 (-2.06%) |
332.65 |
324.50 - 335.60 |
1.0818 times |
Wed 15 October 2025 |
332.95 (5.36%) |
322.05 |
316.90 - 334.50 |
2.1735 times |
Tue 14 October 2025 |
316.00 (-1.08%) |
321.40 |
302.00 - 322.90 |
1.8104 times |
Mon 13 October 2025 |
319.45 (-4.8%) |
333.00 |
317.40 - 333.00 |
1.3282 times |
Fri 10 October 2025 |
335.55 (-2.29%) |
342.05 |
334.10 - 347.95 |
0.5341 times |
Thu 09 October 2025 |
343.40 (2.46%) |
334.25 |
333.55 - 346.00 |
0.533 times |
Wed 08 October 2025 |
335.15 (-0.99%) |
337.00 |
333.00 - 341.75 |
1.2068 times |
Weekly price and charts GngElectronics Strong weekly Stock price targets for GngElectronics 544455 are 322.15 and 337.7 | Weekly Target 1 | 310.77 | | Weekly Target 2 | 317.98 | | Weekly Target 3 | 326.31666666667 | | Weekly Target 4 | 333.53 | | Weekly Target 5 | 341.87 |
Weekly price and volumes for Gng Electronics
| Date |
Closing |
Open |
Range |
Volume |
Thu 23 October 2025 |
325.20 (0.71%) |
325.00 |
319.10 - 334.65 |
0.1206 times |
Fri 17 October 2025 |
322.90 (-3.77%) |
333.00 |
302.00 - 335.60 |
0.3772 times |
Fri 10 October 2025 |
335.55 (-4.82%) |
354.70 |
333.00 - 354.70 |
0.1953 times |
Fri 03 October 2025 |
352.55 (2.1%) |
354.75 |
334.00 - 360.00 |
0.2603 times |
Fri 26 September 2025 |
345.30 (-8.69%) |
378.05 |
341.25 - 386.40 |
0.4475 times |
Fri 19 September 2025 |
378.15 (6.52%) |
359.90 |
351.45 - 401.45 |
0.9353 times |
Fri 12 September 2025 |
355.00 (-2.45%) |
374.80 |
341.00 - 374.80 |
0.696 times |
Fri 05 September 2025 |
363.90 (6.34%) |
344.85 |
339.30 - 370.00 |
1.261 times |
Fri 29 August 2025 |
342.20 (-0.9%) |
346.10 |
330.95 - 379.80 |
3.0336 times |
Fri 22 August 2025 |
345.30 (7.12%) |
328.95 |
324.65 - 353.00 |
2.6734 times |
Thu 14 August 2025 |
322.35 (0.81%) |
328.25 |
314.00 - 339.70 |
1.3278 times |

Monthly price and charts GngElectronics Strong monthly Stock price targets for GngElectronics 544455 are 284.6 and 342.6 | Monthly Target 1 | 271.07 | | Monthly Target 2 | 298.13 | | Monthly Target 3 | 329.06666666667 | | Monthly Target 4 | 356.13 | | Monthly Target 5 | 387.07 |
Monthly price and volumes Gng Electronics
| Date |
Closing |
Open |
Range |
Volume |
Thu 23 October 2025 |
325.20 (-6.74%) |
360.00 |
302.00 - 360.00 |
0.1818 times |
Tue 30 September 2025 |
348.70 (1.9%) |
344.85 |
334.00 - 401.45 |
0.7503 times |
Fri 29 August 2025 |
342.20 (3.37%) |
332.30 |
299.85 - 379.80 |
2.553 times |
Thu 31 July 2025 |
331.05 (0%) |
325.00 |
320.95 - 345.00 |
0.5148 times |
Thu 23 October 2025 |
(0%) |
|
- |
0 times |

DMA SMA EMA moving averages of Gng Electronics 544455
DMA (daily moving average) of Gng Electronics 544455
| DMA period | DMA value | | 5 day DMA | 326.35 | | 12 day DMA | 329.4 | | 20 day DMA | 337.33 | | 35 day DMA | 348.77 | | 50 day DMA | 346.07 | | 100 day DMA | | | 150 day DMA | | | 200 day DMA | | EMA (exponential moving average) of Gng Electronics 544455
| EMA period | EMA current | EMA prev | EMA prev2 | | 5 day EMA | 327.2 | 328.2 | 325.9 | | 12 day EMA | 331.19 | 332.28 | 332.18 | | 20 day EMA | 335.91 | 337.04 | 337.49 | | 35 day EMA | 338.02 | 338.77 | 339.12 | | 50 day EMA | 341.36 | 342.02 | 342.4 |
SMA (simple moving average) of Gng Electronics 544455
| SMA period | SMA current | SMA prev | SMA prev2 | | 5 day SMA | 326.35 | 327.9 | 324.54 | | 12 day SMA | 329.4 | 330.94 | 332.59 | | 20 day SMA | 337.33 | 339.75 | 341.89 | | 35 day SMA | 348.77 | 349.27 | 349.85 | | 50 day SMA | 346.07 | 345.96 | 345.53 | | 100 day SMA | | 150 day SMA | | 200 day SMA |
|
|
