ChembondChemicals 544450 full analysis,charts,indicators,moving averages,SMA,DMA,EMA,ADX,MACD,RSIChembond Chemicals 544450 WideScreen charts, DMA,SMA,EMA technical analysis, forecast prediction, by indicators ADX,MACD,RSI,CCI BSE stock exchange
Daily price and charts and targets ChembondChemicals Strong Daily Stock price targets for ChembondChemicals 544450 are 153.05 and 154.6 | Daily Target 1 | 151.8 | | Daily Target 2 | 152.75 | | Daily Target 3 | 153.35 | | Daily Target 4 | 154.3 | | Daily Target 5 | 154.9 |
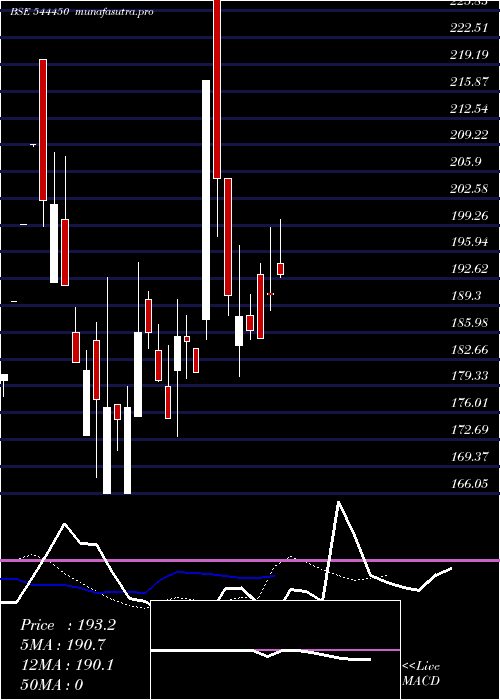
Daily price and volume Chembond Chemicals
| Date |
Closing |
Open |
Range |
Volume |
Fri 05 December 2025 |
153.70 (2.47%) |
152.50 |
152.40 - 153.95 |
1.0443 times |
Thu 04 December 2025 |
150.00 (-1.96%) |
148.40 |
148.40 - 152.00 |
0.2945 times |
Wed 03 December 2025 |
153.00 (2.72%) |
149.90 |
148.75 - 153.00 |
0.533 times |
Tue 02 December 2025 |
148.95 (-1.65%) |
151.20 |
146.60 - 151.20 |
1.0316 times |
Mon 01 December 2025 |
151.45 (-0.98%) |
150.85 |
147.70 - 151.60 |
1.8934 times |
Fri 28 November 2025 |
152.95 (0.62%) |
146.60 |
146.60 - 152.95 |
0.6396 times |
Thu 27 November 2025 |
152.00 (1.3%) |
153.00 |
150.00 - 156.05 |
1.4959 times |
Wed 26 November 2025 |
150.05 (-0.03%) |
149.30 |
149.30 - 154.00 |
0.3144 times |
Tue 25 November 2025 |
150.10 (-1.54%) |
150.05 |
148.75 - 155.00 |
1.9169 times |
Mon 24 November 2025 |
152.45 (-5.31%) |
161.85 |
150.10 - 161.85 |
0.8365 times |
Fri 21 November 2025 |
161.00 (0.56%) |
164.90 |
156.45 - 164.90 |
0.7335 times |
Weekly price and charts ChembondChemicals Strong weekly Stock price targets for ChembondChemicals 544450 are 150.15 and 157.5 | Weekly Target 1 | 144.07 | | Weekly Target 2 | 148.88 | | Weekly Target 3 | 151.41666666667 | | Weekly Target 4 | 156.23 | | Weekly Target 5 | 158.77 |
Weekly price and volumes for Chembond Chemicals
| Date |
Closing |
Open |
Range |
Volume |
Fri 05 December 2025 |
153.70 (0.49%) |
150.85 |
146.60 - 153.95 |
0.5072 times |
Fri 28 November 2025 |
152.95 (-5%) |
161.85 |
146.60 - 161.85 |
0.5502 times |
Fri 21 November 2025 |
161.00 (10.2%) |
148.95 |
148.90 - 164.90 |
0.2764 times |
Fri 14 November 2025 |
146.10 (-5.04%) |
152.15 |
144.10 - 152.85 |
0.8249 times |
Fri 07 November 2025 |
153.85 (-3.24%) |
159.00 |
150.95 - 163.00 |
0.248 times |
Fri 31 October 2025 |
159.00 (0.44%) |
160.25 |
155.85 - 164.30 |
0.4487 times |
Thu 23 October 2025 |
158.30 (5.15%) |
151.20 |
150.30 - 167.90 |
0.963 times |
Fri 17 October 2025 |
150.55 (-5.91%) |
158.00 |
149.55 - 164.00 |
1.9971 times |
Fri 10 October 2025 |
160.00 (-1.99%) |
165.05 |
156.15 - 174.80 |
1.5544 times |
Fri 03 October 2025 |
163.25 (-1.06%) |
160.10 |
158.85 - 192.90 |
2.6301 times |
Fri 26 September 2025 |
165.00 (-12.14%) |
193.00 |
164.20 - 193.00 |
8.4958 times |

Monthly price and charts ChembondChemicals Strong monthly Stock price targets for ChembondChemicals 544450 are 150.15 and 157.5 | Monthly Target 1 | 144.07 | | Monthly Target 2 | 148.88 | | Monthly Target 3 | 151.41666666667 | | Monthly Target 4 | 156.23 | | Monthly Target 5 | 158.77 |
Monthly price and volumes Chembond Chemicals
| Date |
Closing |
Open |
Range |
Volume |
Fri 05 December 2025 |
153.70 (0.49%) |
150.85 |
146.60 - 153.95 |
0.0426 times |
Fri 28 November 2025 |
152.95 (-3.81%) |
159.00 |
144.10 - 164.90 |
0.1594 times |
Fri 31 October 2025 |
159.00 (-5.27%) |
169.55 |
149.55 - 192.90 |
0.4724 times |
Tue 30 September 2025 |
167.85 (-9.83%) |
193.10 |
158.85 - 218.00 |
2.8285 times |
Fri 29 August 2025 |
186.15 (-7.78%) |
200.00 |
166.05 - 245.25 |
2.0366 times |
Thu 31 July 2025 |
201.86 (0%) |
180.00 |
178.05 - 219.73 |
0.4605 times |
Sun 07 December 2025 |
(0%) |
|
- |
0 times |

DMA SMA EMA moving averages of Chembond Chemicals 544450
DMA (daily moving average) of Chembond Chemicals 544450
| DMA period | DMA value | | 5 day DMA | 151.42 | | 12 day DMA | 152.98 | | 20 day DMA | 151.43 | | 35 day DMA | 153.64 | | 50 day DMA | 157.77 | | 100 day DMA | | | 150 day DMA | | | 200 day DMA | | EMA (exponential moving average) of Chembond Chemicals 544450
| EMA period | EMA current | EMA prev | EMA prev2 | | 5 day EMA | 151.98 | 151.12 | 151.68 | | 12 day EMA | 152.05 | 151.75 | 152.07 | | 20 day EMA | 152.94 | 152.86 | 153.16 | | 35 day EMA | 156.17 | 156.32 | 156.69 | | 50 day EMA | 159.7 | 159.94 | 160.35 |
SMA (simple moving average) of Chembond Chemicals 544450
| SMA period | SMA current | SMA prev | SMA prev2 | | 5 day SMA | 151.42 | 151.27 | 151.67 | | 12 day SMA | 152.98 | 152.65 | 152.83 | | 20 day SMA | 151.43 | 151.38 | 151.63 | | 35 day SMA | 153.64 | 153.72 | 154 | | 50 day SMA | 157.77 | 158.45 | 159.25 | | 100 day SMA | | 150 day SMA | | 200 day SMA |
|
|
