IndefManufacturing 544364 full analysis,charts,indicators,moving averages,SMA,DMA,EMA,ADX,MACD,RSIIndef Manufacturing 544364 WideScreen charts, DMA,SMA,EMA technical analysis, forecast prediction, by indicators ADX,MACD,RSI,CCI BSE stock exchange
Daily price and charts and targets IndefManufacturing Strong Daily Stock price targets for IndefManufacturing 544364 are 328.6 and 379.4 | Daily Target 1 | 291.6 | | Daily Target 2 | 314.8 | | Daily Target 3 | 342.4 | | Daily Target 4 | 365.6 | | Daily Target 5 | 393.2 |
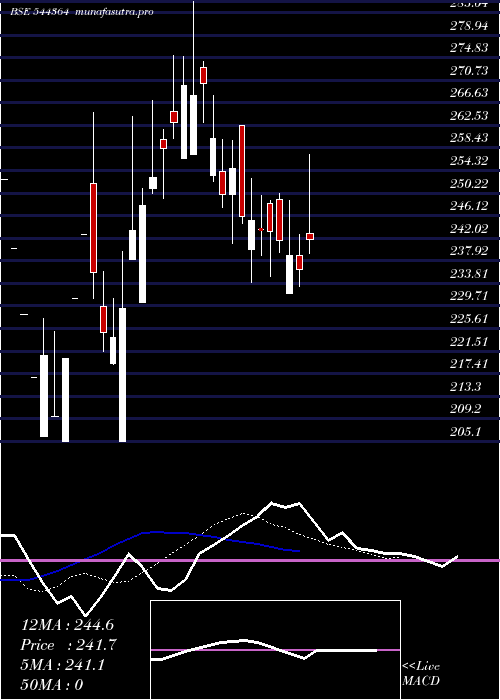
Daily price and volume Indef Manufacturing
| Date |
Closing |
Open |
Range |
Volume |
Fri 05 December 2025 |
338.00 (6.83%) |
322.00 |
319.20 - 370.00 |
4.8272 times |
Thu 04 December 2025 |
316.40 (-1.6%) |
320.05 |
315.00 - 323.00 |
0.2146 times |
Wed 03 December 2025 |
321.55 (-0.57%) |
324.00 |
320.00 - 327.60 |
0.2858 times |
Tue 02 December 2025 |
323.40 (-2.33%) |
327.00 |
320.30 - 330.65 |
1.0784 times |
Mon 01 December 2025 |
331.10 (-1.16%) |
342.40 |
330.10 - 342.40 |
0.5065 times |
Fri 28 November 2025 |
335.00 (-1.18%) |
342.95 |
335.00 - 345.35 |
0.205 times |
Thu 27 November 2025 |
339.00 (1.65%) |
332.10 |
332.10 - 344.20 |
0.4131 times |
Wed 26 November 2025 |
333.50 (-0.01%) |
341.00 |
332.25 - 341.00 |
0.2408 times |
Tue 25 November 2025 |
333.55 (-2.85%) |
341.60 |
332.80 - 341.60 |
0.2722 times |
Mon 24 November 2025 |
343.35 (2.04%) |
336.05 |
330.10 - 345.00 |
1.9562 times |
Fri 21 November 2025 |
336.50 (-3.57%) |
343.40 |
333.00 - 343.40 |
0.7294 times |
Weekly price and charts IndefManufacturing Strong weekly Stock price targets for IndefManufacturing 544364 are 299 and 354 | Weekly Target 1 | 286 | | Weekly Target 2 | 312 | | Weekly Target 3 | 341 | | Weekly Target 4 | 367 | | Weekly Target 5 | 396 |
Weekly price and volumes for Indef Manufacturing
| Date |
Closing |
Open |
Range |
Volume |
Fri 05 December 2025 |
338.00 (0.9%) |
342.40 |
315.00 - 370.00 |
0.8245 times |
Fri 28 November 2025 |
335.00 (-0.45%) |
336.05 |
330.10 - 345.35 |
0.3683 times |
Fri 21 November 2025 |
336.50 (-7.26%) |
367.00 |
333.00 - 375.15 |
0.364 times |
Fri 14 November 2025 |
362.85 (-2.05%) |
404.00 |
359.65 - 404.00 |
0.4082 times |
Fri 07 November 2025 |
370.45 (-2.9%) |
381.50 |
354.55 - 400.00 |
0.3299 times |
Fri 31 October 2025 |
381.50 (-4.68%) |
399.80 |
380.10 - 420.30 |
0.7577 times |
Thu 23 October 2025 |
400.25 (-1.86%) |
408.55 |
368.50 - 420.05 |
0.2405 times |
Fri 17 October 2025 |
407.85 (-3.5%) |
426.85 |
390.00 - 449.00 |
1.5036 times |
Fri 10 October 2025 |
422.65 (15.37%) |
366.35 |
366.35 - 442.45 |
4.6315 times |
Fri 03 October 2025 |
366.35 (0.62%) |
365.30 |
345.20 - 376.50 |
0.5717 times |
Fri 26 September 2025 |
364.10 (-10.52%) |
426.90 |
362.40 - 426.90 |
0.8829 times |

Monthly price and charts IndefManufacturing Strong monthly Stock price targets for IndefManufacturing 544364 are 299 and 354 | Monthly Target 1 | 286 | | Monthly Target 2 | 312 | | Monthly Target 3 | 341 | | Monthly Target 4 | 367 | | Monthly Target 5 | 396 |
Monthly price and volumes Indef Manufacturing
| Date |
Closing |
Open |
Range |
Volume |
Fri 05 December 2025 |
338.00 (0.9%) |
342.40 |
315.00 - 370.00 |
0.0642 times |
Fri 28 November 2025 |
335.00 (-12.19%) |
381.50 |
330.10 - 404.00 |
0.1145 times |
Fri 31 October 2025 |
381.50 (5%) |
359.65 |
345.20 - 449.00 |
0.5788 times |
Tue 30 September 2025 |
363.35 (0.55%) |
365.05 |
329.05 - 426.90 |
0.3524 times |
Fri 29 August 2025 |
361.35 (-15.83%) |
434.00 |
348.85 - 447.50 |
0.5743 times |
Thu 31 July 2025 |
429.30 (-15.26%) |
530.00 |
390.70 - 580.85 |
3.6109 times |
Mon 30 June 2025 |
506.60 (105.1%) |
233.05 |
233.05 - 506.60 |
3.5392 times |
Fri 30 May 2025 |
247.00 (8.67%) |
226.00 |
202.05 - 249.90 |
0.2954 times |
Wed 30 April 2025 |
227.30 (-12.59%) |
254.10 |
223.00 - 262.55 |
0.2591 times |
Fri 28 March 2025 |
260.05 (20%) |
205.90 |
205.10 - 285.00 |
0.6112 times |
Fri 28 February 2025 |
216.70 (0%) |
252.70 |
216.70 - 252.70 |
0.1637 times |

DMA SMA EMA moving averages of Indef Manufacturing 544364
DMA (daily moving average) of Indef Manufacturing 544364
| DMA period | DMA value | | 5 day DMA | 326.09 | | 12 day DMA | 333.36 | | 20 day DMA | 346.74 | | 35 day DMA | 366.43 | | 50 day DMA | 372.98 | | 100 day DMA | 384.84 | | 150 day DMA | 367.48 | | 200 day DMA | | EMA (exponential moving average) of Indef Manufacturing 544364
| EMA period | EMA current | EMA prev | EMA prev2 | | 5 day EMA | 328.89 | 324.33 | 328.3 | | 12 day EMA | 335.65 | 335.22 | 338.64 | | 20 day EMA | 344.58 | 345.27 | 348.31 | | 35 day EMA | 356.7 | 357.8 | 360.24 | | 50 day EMA | 369.22 | 370.49 | 372.7 |
SMA (simple moving average) of Indef Manufacturing 544364
| SMA period | SMA current | SMA prev | SMA prev2 | | 5 day SMA | 326.09 | 325.49 | 330.01 | | 12 day SMA | 333.36 | 334.85 | 338.65 | | 20 day SMA | 346.74 | 347.99 | 350.76 | | 35 day SMA | 366.43 | 368.75 | 371.79 | | 50 day SMA | 372.98 | 374.35 | 376.06 | | 100 day SMA | 384.84 | 386.16 | 387.94 | | 150 day SMA | 367.48 | 366.8 | 366.22 | | 200 day SMA |
|
|
