IndoFarm 544328 full analysis,charts,indicators,moving averages,SMA,DMA,EMA,ADX,MACD,RSIIndo Farm 544328 WideScreen charts, DMA,SMA,EMA technical analysis, forecast prediction, by indicators ADX,MACD,RSI,CCI BSE stock exchange
Daily price and charts and targets IndoFarm Strong Daily Stock price targets for IndoFarm 544328 are 257.1 and 271.2 | Daily Target 1 | 246.32 | | Daily Target 2 | 253.78 | | Daily Target 3 | 260.41666666667 | | Daily Target 4 | 267.88 | | Daily Target 5 | 274.52 |
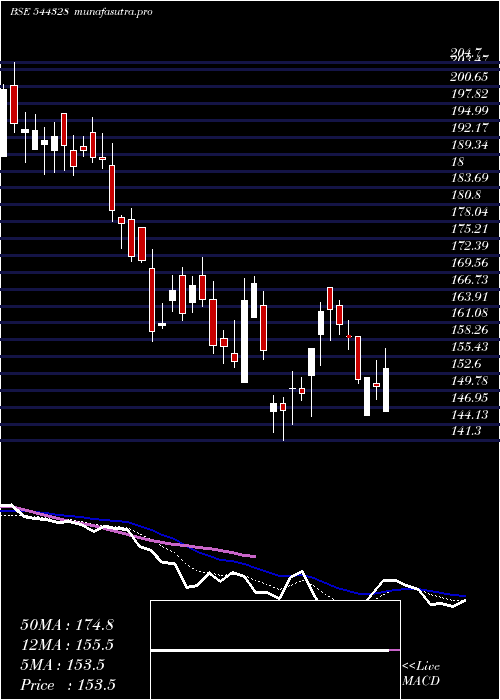
Daily price and volume Indo Farm
| Date |
Closing |
Open |
Range |
Volume |
Tue 21 October 2025 |
261.25 (4.54%) |
258.35 |
252.95 - 267.05 |
0.6198 times |
Mon 20 October 2025 |
249.90 (5.35%) |
240.45 |
240.05 - 271.50 |
5.4358 times |
Fri 17 October 2025 |
237.20 (-0.92%) |
237.50 |
234.55 - 240.00 |
0.2631 times |
Thu 16 October 2025 |
239.40 (-1.34%) |
242.70 |
236.50 - 244.05 |
0.3468 times |
Wed 15 October 2025 |
242.65 (2.64%) |
241.15 |
233.95 - 245.90 |
0.4465 times |
Tue 14 October 2025 |
236.40 (4.79%) |
228.80 |
227.70 - 241.70 |
0.9344 times |
Mon 13 October 2025 |
225.60 (-2.36%) |
242.80 |
224.80 - 242.80 |
0.331 times |
Fri 10 October 2025 |
231.05 (-2.14%) |
238.45 |
229.60 - 240.10 |
0.254 times |
Thu 09 October 2025 |
236.10 (-3.51%) |
249.00 |
235.35 - 249.00 |
0.3017 times |
Wed 08 October 2025 |
244.70 (-0.04%) |
244.50 |
241.05 - 249.75 |
1.0669 times |
Tue 07 October 2025 |
244.80 (4.64%) |
234.95 |
230.45 - 250.80 |
0.8873 times |
Weekly price and charts IndoFarm Strong weekly Stock price targets for IndoFarm 544328 are 250.65 and 282.1 | Weekly Target 1 | 226.15 | | Weekly Target 2 | 243.7 | | Weekly Target 3 | 257.6 | | Weekly Target 4 | 275.15 | | Weekly Target 5 | 289.05 |
Weekly price and volumes for Indo Farm
| Date |
Closing |
Open |
Range |
Volume |
Tue 21 October 2025 |
261.25 (10.14%) |
240.45 |
240.05 - 271.50 |
1.0714 times |
Fri 17 October 2025 |
237.20 (2.66%) |
242.80 |
224.80 - 245.90 |
0.4108 times |
Fri 10 October 2025 |
231.05 (-3.59%) |
237.55 |
229.60 - 250.80 |
0.5207 times |
Fri 03 October 2025 |
239.65 (5.04%) |
232.55 |
217.10 - 243.10 |
0.5066 times |
Fri 26 September 2025 |
228.15 (-11.81%) |
258.50 |
226.50 - 267.90 |
0.8862 times |
Fri 19 September 2025 |
258.70 (0.51%) |
259.95 |
240.95 - 265.00 |
0.7578 times |
Fri 12 September 2025 |
257.40 (5.06%) |
246.30 |
245.60 - 262.75 |
1.0349 times |
Fri 05 September 2025 |
245.00 (9.69%) |
229.45 |
224.30 - 270.75 |
2.5564 times |
Fri 29 August 2025 |
223.35 (-1%) |
226.30 |
216.65 - 237.00 |
0.449 times |
Fri 22 August 2025 |
225.60 (13.6%) |
198.95 |
196.45 - 253.60 |
1.8062 times |
Thu 14 August 2025 |
198.60 (-4.91%) |
210.00 |
197.00 - 219.60 |
0.1843 times |

Monthly price and charts IndoFarm Strong monthly Stock price targets for IndoFarm 544328 are 242.28 and 290.48 | Monthly Target 1 | 203.82 | | Monthly Target 2 | 232.53 | | Monthly Target 3 | 252.01666666667 | | Monthly Target 4 | 280.73 | | Monthly Target 5 | 300.22 |
Monthly price and volumes Indo Farm
| Date |
Closing |
Open |
Range |
Volume |
Tue 21 October 2025 |
261.25 (18.37%) |
224.00 |
223.30 - 271.50 |
0.9109 times |
Tue 30 September 2025 |
220.70 (-1.19%) |
229.45 |
217.10 - 270.75 |
2.1266 times |
Fri 29 August 2025 |
223.35 (7.35%) |
209.90 |
184.35 - 253.60 |
1.186 times |
Thu 31 July 2025 |
208.05 (22.42%) |
168.50 |
167.85 - 227.00 |
0.4183 times |
Mon 30 June 2025 |
169.95 (3.88%) |
166.80 |
155.25 - 178.15 |
0.0839 times |
Fri 30 May 2025 |
163.60 (6.61%) |
147.60 |
136.10 - 170.50 |
0.0909 times |
Wed 30 April 2025 |
153.45 (-0.78%) |
151.10 |
141.30 - 168.90 |
0.1667 times |
Fri 28 March 2025 |
154.65 (-19.6%) |
196.20 |
153.65 - 196.20 |
0.4674 times |
Fri 28 February 2025 |
192.35 (-2.93%) |
194.00 |
155.70 - 221.35 |
1.4926 times |
Fri 31 January 2025 |
198.15 (0%) |
275.90 |
170.65 - 292.30 |
3.0566 times |
Thu 23 October 2025 |
(0%) |
|
- |
0 times |

DMA SMA EMA moving averages of Indo Farm 544328
DMA (daily moving average) of Indo Farm 544328
| DMA period | DMA value | | 5 day DMA | 246.08 | | 12 day DMA | 240.25 | | 20 day DMA | 239.26 | | 35 day DMA | 245.29 | | 50 day DMA | 236.89 | | 100 day DMA | 209.57 | | 150 day DMA | 192.53 | | 200 day DMA | | EMA (exponential moving average) of Indo Farm 544328
| EMA period | EMA current | EMA prev | EMA prev2 | | 5 day EMA | 248.19 | 241.66 | 237.54 | | 12 day EMA | 242.95 | 239.62 | 237.75 | | 20 day EMA | 241.56 | 239.49 | 238.39 | | 35 day EMA | 236.71 | 235.26 | 234.4 | | 50 day EMA | 234.51 | 233.42 | 232.75 |
SMA (simple moving average) of Indo Farm 544328
| SMA period | SMA current | SMA prev | SMA prev2 | | 5 day SMA | 246.08 | 241.11 | 236.25 | | 12 day SMA | 240.25 | 238.45 | 237.36 | | 20 day SMA | 239.26 | 239.33 | 239.77 | | 35 day SMA | 245.29 | 244.57 | 243.81 | | 50 day SMA | 236.89 | 235.74 | 234.48 | | 100 day SMA | 209.57 | 208.53 | 207.57 | | 150 day SMA | 192.53 | 192.06 | 191.64 | | 200 day SMA |
|
|
