NacdacInfrastructure 544313 full analysis,charts,indicators,moving averages,SMA,DMA,EMA,ADX,MACD,RSINacdac Infrastructure 544313 WideScreen charts, DMA,SMA,EMA technical analysis, forecast prediction, by indicators ADX,MACD,RSI,CCI BSE stock exchange
Daily price and charts and targets NacdacInfrastructure Strong Daily Stock price targets for NacdacInfrastructure 544313 are 32.15 and 32.45 | Daily Target 1 | 31.9 | | Daily Target 2 | 32.1 | | Daily Target 3 | 32.2 | | Daily Target 4 | 32.4 | | Daily Target 5 | 32.5 |
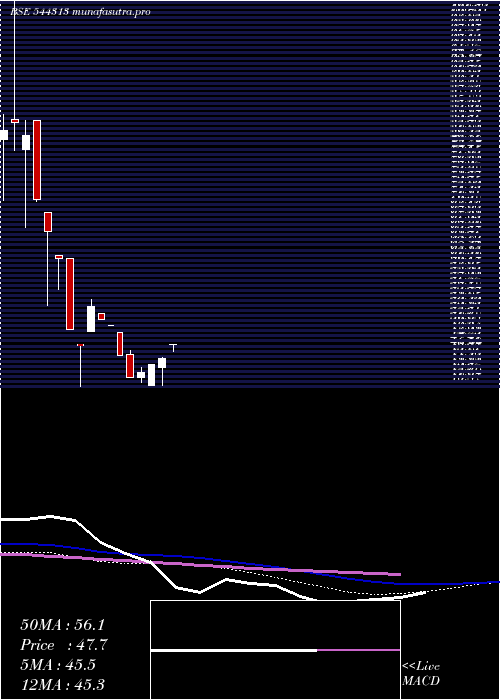
Daily price and volume Nacdac Infrastructure
| Date |
Closing |
Open |
Range |
Volume |
Tue 02 September 2025 |
32.30 (0.91%) |
32.20 |
32.00 - 32.30 |
1.0714 times |
Mon 01 September 2025 |
32.01 (0%) |
32.02 |
32.01 - 32.02 |
0.7143 times |
Thu 28 August 2025 |
32.01 (-3.26%) |
32.20 |
32.01 - 32.20 |
0.7143 times |
Tue 26 August 2025 |
33.09 (0.12%) |
32.20 |
32.20 - 34.25 |
1.4286 times |
Mon 25 August 2025 |
33.05 (-3.92%) |
34.50 |
33.05 - 34.50 |
1.4286 times |
Fri 22 August 2025 |
34.40 (1.18%) |
34.40 |
34.40 - 34.40 |
0.3571 times |
Thu 21 August 2025 |
34.00 (1.43%) |
34.00 |
34.00 - 34.00 |
1.7857 times |
Wed 20 August 2025 |
33.52 (-4.2%) |
33.41 |
33.41 - 33.52 |
1.0714 times |
Mon 18 August 2025 |
34.99 (4.45%) |
33.50 |
33.50 - 34.99 |
1.0714 times |
Thu 14 August 2025 |
33.50 (2.26%) |
33.50 |
33.50 - 33.50 |
0.3571 times |
Wed 13 August 2025 |
32.76 (-3.65%) |
33.70 |
32.50 - 33.70 |
2.1429 times |

Weekly price and charts NacdacInfrastructure Strong weekly Stock price targets for NacdacInfrastructure 544313 are 32.15 and 32.45 | Weekly Target 1 | 31.9 | | Weekly Target 2 | 32.1 | | Weekly Target 3 | 32.2 | | Weekly Target 4 | 32.4 | | Weekly Target 5 | 32.5 |
Weekly price and volumes for Nacdac Infrastructure
| Date |
Closing |
Open |
Range |
Volume |
Tue 02 September 2025 |
32.30 (0.91%) |
32.02 |
32.00 - 32.30 |
0.365 times |
Thu 28 August 2025 |
32.01 (-6.95%) |
34.50 |
32.01 - 34.50 |
0.7299 times |
Fri 22 August 2025 |
34.40 (2.69%) |
33.50 |
33.41 - 34.99 |
0.8759 times |
Thu 14 August 2025 |
33.50 (-11.61%) |
36.51 |
32.30 - 36.51 |
1.2409 times |
Fri 08 August 2025 |
37.90 (6.76%) |
35.89 |
35.89 - 43.15 |
1.5328 times |
Fri 01 August 2025 |
35.50 (-4.05%) |
37.80 |
34.30 - 37.80 |
0.5109 times |
Fri 25 July 2025 |
37.00 (-7.5%) |
38.01 |
37.00 - 39.38 |
1.1679 times |
Thu 17 July 2025 |
40.00 (6.1%) |
37.91 |
37.91 - 40.00 |
1.0219 times |
Fri 11 July 2025 |
37.70 (-7.67%) |
38.85 |
37.15 - 39.95 |
1.2409 times |
Fri 04 July 2025 |
40.83 (9.14%) |
39.18 |
37.05 - 40.84 |
1.3139 times |
Thu 26 June 2025 |
37.41 (-3.08%) |
38.01 |
37.41 - 40.50 |
2.4818 times |
Monthly price and charts NacdacInfrastructure Strong monthly Stock price targets for NacdacInfrastructure 544313 are 32.15 and 32.45 | Monthly Target 1 | 31.9 | | Monthly Target 2 | 32.1 | | Monthly Target 3 | 32.2 | | Monthly Target 4 | 32.4 | | Monthly Target 5 | 32.5 |
Monthly price and volumes Nacdac Infrastructure
| Date |
Closing |
Open |
Range |
Volume |
Tue 02 September 2025 |
32.30 (0.91%) |
32.02 |
32.00 - 32.30 |
0.0172 times |
Thu 28 August 2025 |
32.01 (-12.06%) |
34.30 |
32.01 - 43.15 |
0.2128 times |
Wed 30 July 2025 |
36.40 (-1.75%) |
37.25 |
36.40 - 40.84 |
0.2266 times |
Mon 30 June 2025 |
37.05 (-10.77%) |
43.50 |
37.05 - 43.50 |
0.5321 times |
Fri 30 May 2025 |
41.52 (-10.63%) |
44.14 |
38.65 - 45.50 |
0.4188 times |
Wed 30 April 2025 |
46.46 (9.86%) |
42.29 |
40.98 - 47.65 |
0.4703 times |
Fri 28 March 2025 |
42.29 (-21.38%) |
52.72 |
42.29 - 52.72 |
0.1579 times |
Fri 28 February 2025 |
53.79 (-18.5%) |
62.00 |
40.87 - 62.00 |
0.7003 times |
Fri 31 January 2025 |
66.00 (-16.01%) |
74.66 |
54.00 - 106.40 |
5.781 times |
Tue 31 December 2024 |
78.58 (0%) |
73.31 |
73.31 - 84.85 |
1.483 times |
Wed 03 September 2025 |
(0%) |
|
- |
0 times |

DMA SMA EMA moving averages of Nacdac Infrastructure 544313
DMA (daily moving average) of Nacdac Infrastructure 544313
| DMA period | DMA value | | 5 day DMA | 32.49 | | 12 day DMA | 33.3 | | 20 day DMA | 34.79 | | 35 day DMA | 36.47 | | 50 day DMA | 37.34 | | 100 day DMA | 40.39 | | 150 day DMA | | | 200 day DMA | | EMA (exponential moving average) of Nacdac Infrastructure 544313
| EMA period | EMA current | EMA prev | EMA prev2 | | 5 day EMA | 32.58 | 32.72 | 33.07 | | 12 day EMA | 33.56 | 33.79 | 34.11 | | 20 day EMA | 34.53 | 34.77 | 35.06 | | 35 day EMA | 35.9 | 36.11 | 36.35 | | 50 day EMA | 37.22 | 37.42 | 37.64 |
SMA (simple moving average) of Nacdac Infrastructure 544313
| SMA period | SMA current | SMA prev | SMA prev2 | | 5 day SMA | 32.49 | 32.91 | 33.31 | | 12 day SMA | 33.3 | 33.65 | 34.14 | | 20 day SMA | 34.79 | 35.03 | 35.31 | | 35 day SMA | 36.47 | 36.72 | 36.91 | | 50 day SMA | 37.34 | 37.52 | 37.71 | | 100 day SMA | 40.39 | 40.6 | 40.83 | | 150 day SMA | | 200 day SMA |
|
|
