RossellTechsys 544294 full analysis,charts,indicators,moving averages,SMA,DMA,EMA,ADX,MACD,RSIRossell Techsys 544294 WideScreen charts, DMA,SMA,EMA technical analysis, forecast prediction, by indicators ADX,MACD,RSI,CCI BSE stock exchange
Daily price and charts and targets RossellTechsys Strong Daily Stock price targets for RossellTechsys 544294 are 678.13 and 704.68 | Daily Target 1 | 658.87 | | Daily Target 2 | 670.83 | | Daily Target 3 | 685.41666666667 | | Daily Target 4 | 697.38 | | Daily Target 5 | 711.97 |
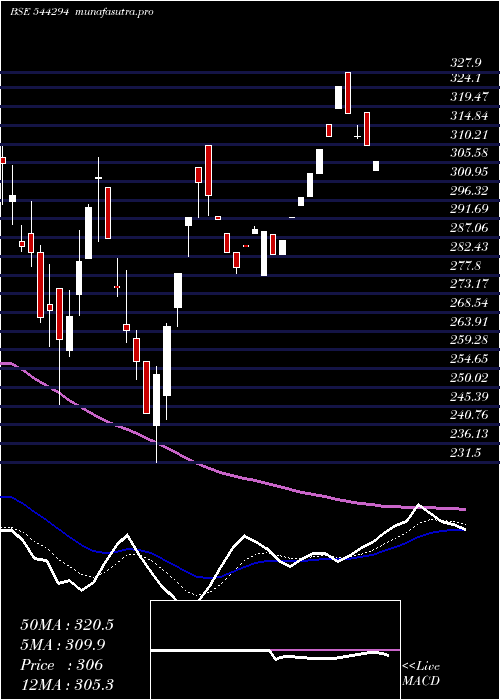
Daily price and volume Rossell Techsys
| Date |
Closing |
Open |
Range |
Volume |
Tue 21 October 2025 |
682.80 (2.28%) |
673.45 |
673.45 - 700.00 |
0.1205 times |
Mon 20 October 2025 |
667.55 (1.21%) |
665.05 |
660.70 - 672.65 |
0.3214 times |
Fri 17 October 2025 |
659.55 (-2.99%) |
676.55 |
654.50 - 678.30 |
0.5736 times |
Thu 16 October 2025 |
679.90 (-0.04%) |
686.35 |
678.35 - 688.70 |
0.2545 times |
Wed 15 October 2025 |
680.20 (1.89%) |
668.90 |
662.65 - 692.50 |
0.6294 times |
Tue 14 October 2025 |
667.60 (-2.33%) |
685.00 |
659.65 - 690.15 |
1.1964 times |
Mon 13 October 2025 |
683.50 (-2.06%) |
692.50 |
676.05 - 692.50 |
0.9165 times |
Fri 10 October 2025 |
697.90 (1.77%) |
744.95 |
684.25 - 744.95 |
1.3049 times |
Thu 09 October 2025 |
685.75 (-1.92%) |
686.75 |
684.05 - 715.00 |
2.1273 times |
Wed 08 October 2025 |
699.15 (0.81%) |
688.05 |
676.10 - 703.15 |
2.5555 times |
Tue 07 October 2025 |
693.55 (-1.37%) |
703.25 |
687.35 - 723.85 |
3.0494 times |
Weekly price and charts RossellTechsys Strong weekly Stock price targets for RossellTechsys 544294 are 671.75 and 711.05 | Weekly Target 1 | 641.87 | | Weekly Target 2 | 662.33 | | Weekly Target 3 | 681.16666666667 | | Weekly Target 4 | 701.63 | | Weekly Target 5 | 720.47 |
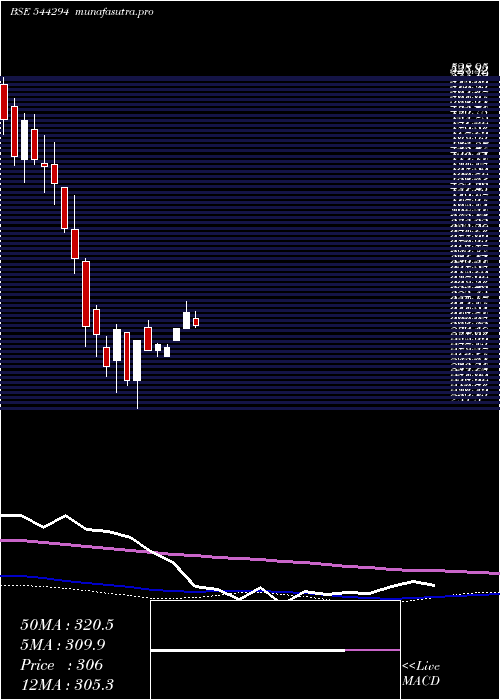
Weekly price and volumes for Rossell Techsys
| Date |
Closing |
Open |
Range |
Volume |
Tue 21 October 2025 |
682.80 (3.53%) |
665.05 |
660.70 - 700.00 |
0.0355 times |
Fri 17 October 2025 |
659.55 (-5.5%) |
692.50 |
654.50 - 692.50 |
0.2867 times |
Fri 10 October 2025 |
697.90 (-3.56%) |
723.90 |
676.10 - 744.95 |
0.854 times |
Fri 03 October 2025 |
723.65 (-0.82%) |
705.15 |
703.80 - 759.95 |
0.5928 times |
Fri 26 September 2025 |
729.60 (-2.66%) |
748.25 |
712.00 - 832.00 |
1.5757 times |
Fri 19 September 2025 |
749.55 (0.53%) |
750.00 |
720.40 - 794.00 |
0.6976 times |
Fri 12 September 2025 |
745.60 (4.13%) |
739.95 |
678.80 - 785.70 |
1.7257 times |
Fri 05 September 2025 |
716.05 (6.91%) |
689.10 |
683.20 - 788.90 |
1.3101 times |
Fri 29 August 2025 |
669.80 (-1.72%) |
712.15 |
638.15 - 712.15 |
0.5748 times |
Fri 22 August 2025 |
681.50 (11.76%) |
617.15 |
617.15 - 734.05 |
2.347 times |
Thu 14 August 2025 |
609.80 (0.93%) |
618.10 |
570.00 - 636.25 |
1.3365 times |
Monthly price and charts RossellTechsys Strong monthly Stock price targets for RossellTechsys 544294 are 615.93 and 721.38 | Monthly Target 1 | 593.63 | | Monthly Target 2 | 638.22 | | Monthly Target 3 | 699.08333333333 | | Monthly Target 4 | 743.67 | | Monthly Target 5 | 804.53 |
Monthly price and volumes Rossell Techsys
| Date |
Closing |
Open |
Range |
Volume |
Tue 21 October 2025 |
682.80 (-3.64%) |
749.85 |
654.50 - 759.95 |
0.6805 times |
Tue 30 September 2025 |
708.60 (5.79%) |
689.10 |
678.80 - 832.00 |
3.0577 times |
Fri 29 August 2025 |
669.80 (19.21%) |
567.45 |
551.80 - 734.05 |
3.0135 times |
Thu 31 July 2025 |
561.85 (34.38%) |
422.00 |
405.00 - 619.90 |
1.6932 times |
Mon 30 June 2025 |
418.10 (7.38%) |
381.60 |
352.25 - 424.00 |
0.3771 times |
Fri 30 May 2025 |
389.35 (27.24%) |
310.00 |
301.10 - 393.00 |
0.2227 times |
Wed 30 April 2025 |
306.00 (8.03%) |
283.40 |
277.60 - 327.90 |
0.0945 times |
Fri 28 March 2025 |
283.25 (5.26%) |
274.50 |
231.50 - 309.90 |
0.3442 times |
Fri 28 February 2025 |
269.10 (-31.54%) |
391.90 |
260.00 - 422.80 |
0.3136 times |
Fri 31 January 2025 |
393.05 (-14.47%) |
463.30 |
390.00 - 497.00 |
0.2029 times |
Tue 31 December 2024 |
459.55 (0%) |
495.50 |
434.95 - 551.00 |
0.8296 times |

DMA SMA EMA moving averages of Rossell Techsys 544294
DMA (daily moving average) of Rossell Techsys 544294
| DMA period | DMA value | | 5 day DMA | 674 | | 12 day DMA | 683.38 | | 20 day DMA | 707.03 | | 35 day DMA | 714.9 | | 50 day DMA | 696.54 | | 100 day DMA | 579.03 | | 150 day DMA | 489.09 | | 200 day DMA | 465.47 | EMA (exponential moving average) of Rossell Techsys 544294
| EMA period | EMA current | EMA prev | EMA prev2 | | 5 day EMA | 675.84 | 672.36 | 674.76 | | 12 day EMA | 686.02 | 686.6 | 690.06 | | 20 day EMA | 694.09 | 695.28 | 698.2 | | 35 day EMA | 689.92 | 690.34 | 691.68 | | 50 day EMA | 684.91 | 685 | 685.71 |
SMA (simple moving average) of Rossell Techsys 544294
| SMA period | SMA current | SMA prev | SMA prev2 | | 5 day SMA | 674 | 670.96 | 674.15 | | 12 day SMA | 683.38 | 686.79 | 692.53 | | 20 day SMA | 707.03 | 712.65 | 716.75 | | 35 day SMA | 714.9 | 715.22 | 715.28 | | 50 day SMA | 696.54 | 694.77 | 692.99 | | 100 day SMA | 579.03 | 576.09 | 573.27 | | 150 day SMA | 489.09 | 486.32 | 483.61 | | 200 day SMA | 465.47 | 464.51 | 463.63 |
|
|
