MangalCompusolution 544287 full analysis,charts,indicators,moving averages,SMA,DMA,EMA,ADX,MACD,RSIMangal Compusolution 544287 WideScreen charts, DMA,SMA,EMA technical analysis, forecast prediction, by indicators ADX,MACD,RSI,CCI BSE stock exchange
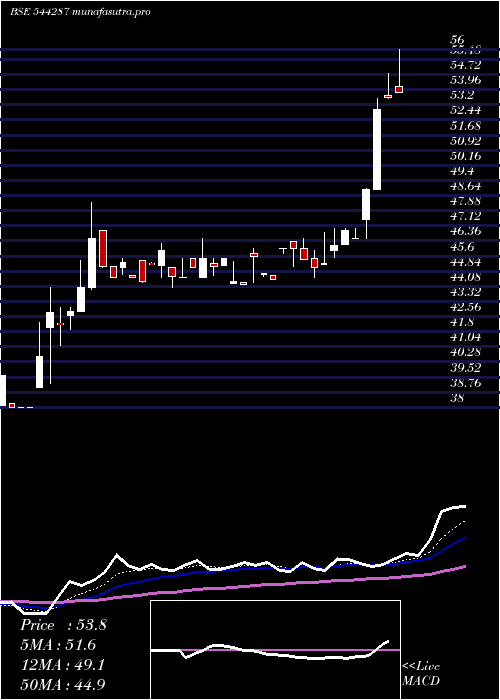
Daily price and charts and targets MangalCompusolution Strong Daily Stock price targets for MangalCompusolution 544287 are 50.97 and 55.52 | Daily Target 1 | 47.26 | | Daily Target 2 | 50.12 | | Daily Target 3 | 51.81 | | Daily Target 4 | 54.67 | | Daily Target 5 | 56.36 |
Daily price and volume Mangal Compusolution
| Date |
Closing |
Open |
Range |
Volume |
Fri 11 July 2025 |
52.98 (8.23%) |
48.95 |
48.95 - 53.50 |
1.9828 times |
Thu 10 July 2025 |
48.95 (5.27%) |
47.45 |
46.50 - 49.00 |
2.3276 times |
Wed 09 July 2025 |
46.50 (-0.81%) |
46.50 |
46.50 - 47.00 |
0.6466 times |
Tue 08 July 2025 |
46.88 (1.58%) |
46.20 |
46.20 - 47.00 |
0.6466 times |
Mon 07 July 2025 |
46.15 (2.08%) |
45.90 |
45.52 - 47.00 |
1.4655 times |
Fri 04 July 2025 |
45.21 (0.47%) |
45.20 |
45.20 - 46.80 |
0.3879 times |
Thu 03 July 2025 |
45.00 (-0.99%) |
45.50 |
44.51 - 45.90 |
0.431 times |
Wed 02 July 2025 |
45.45 (-1.2%) |
46.00 |
45.45 - 46.49 |
0.6034 times |
Tue 01 July 2025 |
46.00 (0%) |
46.35 |
45.05 - 46.35 |
0.431 times |
Mon 30 June 2025 |
46.00 (3.6%) |
46.00 |
45.75 - 46.00 |
1.0776 times |
Fri 27 June 2025 |
44.40 (-0.67%) |
44.60 |
44.40 - 44.60 |
0.1293 times |
Weekly price and charts MangalCompusolution Strong weekly Stock price targets for MangalCompusolution 544287 are 49.25 and 57.23 | Weekly Target 1 | 42.69 | | Weekly Target 2 | 47.83 | | Weekly Target 3 | 50.666666666667 | | Weekly Target 4 | 55.81 | | Weekly Target 5 | 58.65 |
Weekly price and volumes for Mangal Compusolution
| Date |
Closing |
Open |
Range |
Volume |
Fri 11 July 2025 |
52.98 (17.19%) |
45.90 |
45.52 - 53.50 |
2.624 times |
Fri 04 July 2025 |
45.21 (1.82%) |
46.00 |
44.51 - 46.80 |
1.088 times |
Fri 27 June 2025 |
44.40 (-2.4%) |
44.20 |
44.15 - 46.00 |
0.656 times |
Thu 19 June 2025 |
45.49 (2.22%) |
45.50 |
44.50 - 46.48 |
1.072 times |
Fri 13 June 2025 |
44.50 (-0.07%) |
45.40 |
44.00 - 46.25 |
0.992 times |
Fri 06 June 2025 |
44.53 (1.2%) |
44.00 |
43.90 - 48.30 |
1.44 times |
Fri 30 May 2025 |
44.00 (15.79%) |
38.99 |
38.99 - 45.40 |
1.728 times |
Wed 21 May 2025 |
38.00 (-4.09%) |
38.20 |
38.00 - 38.20 |
0.08 times |
Fri 16 May 2025 |
39.62 (1.85%) |
39.00 |
37.00 - 41.87 |
0.24 times |
Fri 02 May 2025 |
38.90 (-1.52%) |
42.00 |
38.51 - 42.00 |
0.08 times |
Fri 25 April 2025 |
39.50 (-2.03%) |
38.42 |
38.42 - 40.77 |
0.128 times |
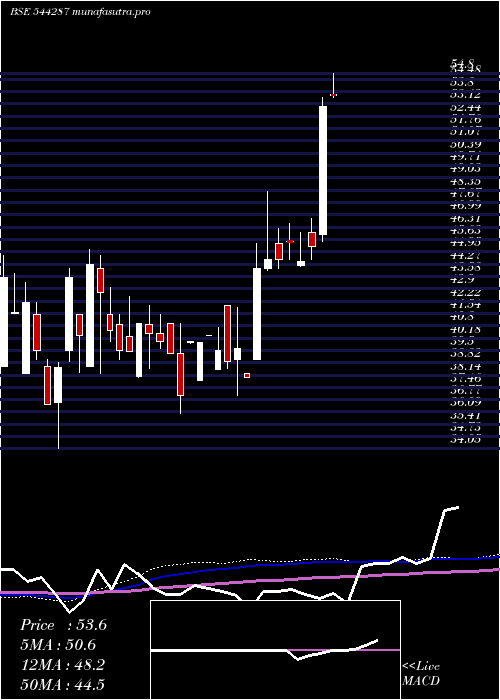
Monthly price and charts MangalCompusolution Strong monthly Stock price targets for MangalCompusolution 544287 are 48.75 and 57.74 | Monthly Target 1 | 41.34 | | Monthly Target 2 | 47.16 | | Monthly Target 3 | 50.33 | | Monthly Target 4 | 56.15 | | Monthly Target 5 | 59.32 |
Monthly price and volumes Mangal Compusolution
| Date |
Closing |
Open |
Range |
Volume |
Fri 11 July 2025 |
52.98 (15.17%) |
46.35 |
44.51 - 53.50 |
1.1851 times |
Mon 30 June 2025 |
46.00 (4.55%) |
44.00 |
43.90 - 48.30 |
1.6317 times |
Fri 30 May 2025 |
44.00 (12.79%) |
38.51 |
37.00 - 45.40 |
0.75 times |
Tue 29 April 2025 |
39.01 (5.43%) |
39.93 |
37.82 - 42.00 |
0.1317 times |
Fri 28 March 2025 |
37.00 (-9.76%) |
40.95 |
36.01 - 42.00 |
0.7328 times |
Fri 28 February 2025 |
41.00 (-3.98%) |
41.50 |
38.00 - 43.00 |
0.2405 times |
Fri 31 January 2025 |
42.70 (25.22%) |
34.10 |
34.10 - 45.10 |
1.042 times |
Tue 31 December 2024 |
34.10 (-21.61%) |
41.55 |
34.05 - 43.75 |
1.3282 times |
Fri 29 November 2024 |
43.50 (0%) |
40.62 |
38.59 - 44.75 |
1.958 times |
Mon 14 July 2025 |
(0%) |
|
- |
0 times |

DMA SMA EMA moving averages of Mangal Compusolution 544287
DMA (daily moving average) of Mangal Compusolution 544287
| DMA period | DMA value | | 5 day DMA | 48.29 | | 12 day DMA | 46.52 | | 20 day DMA | 45.89 | | 35 day DMA | 44.97 | | 50 day DMA | 43.27 | | 100 day DMA | 41.96 | | 150 day DMA | | | 200 day DMA | | EMA (exponential moving average) of Mangal Compusolution 544287
| EMA period | EMA current | EMA prev | EMA prev2 | | 5 day EMA | 49.06 | 47.1 | 46.17 | | 12 day EMA | 47.22 | 46.17 | 45.67 | | 20 day EMA | 46.26 | 45.55 | 45.19 | | 35 day EMA | 44.7 | 44.21 | 43.93 | | 50 day EMA | 43.42 | 43.03 | 42.79 |
SMA (simple moving average) of Mangal Compusolution 544287
| SMA period | SMA current | SMA prev | SMA prev2 | | 5 day SMA | 48.29 | 46.74 | 45.95 | | 12 day SMA | 46.52 | 45.9 | 45.5 | | 20 day SMA | 45.89 | 45.47 | 45.32 | | 35 day SMA | 44.97 | 44.54 | 44.23 | | 50 day SMA | 43.27 | 43.01 | 42.83 | | 100 day SMA | 41.96 | 41.81 | 41.69 | | 150 day SMA | | 200 day SMA |
|
|
