AfconsInfrastructure 544280 full analysis,charts,indicators,moving averages,SMA,DMA,EMA,ADX,MACD,RSIAfcons Infrastructure 544280 WideScreen charts, DMA,SMA,EMA technical analysis, forecast prediction, by indicators ADX,MACD,RSI,CCI BSE stock exchange
Daily price and charts and targets AfconsInfrastructure Strong Daily Stock price targets for AfconsInfrastructure 544280 are 445.28 and 448.08 | Daily Target 1 | 444.67 | | Daily Target 2 | 445.88 | | Daily Target 3 | 447.46666666667 | | Daily Target 4 | 448.68 | | Daily Target 5 | 450.27 |
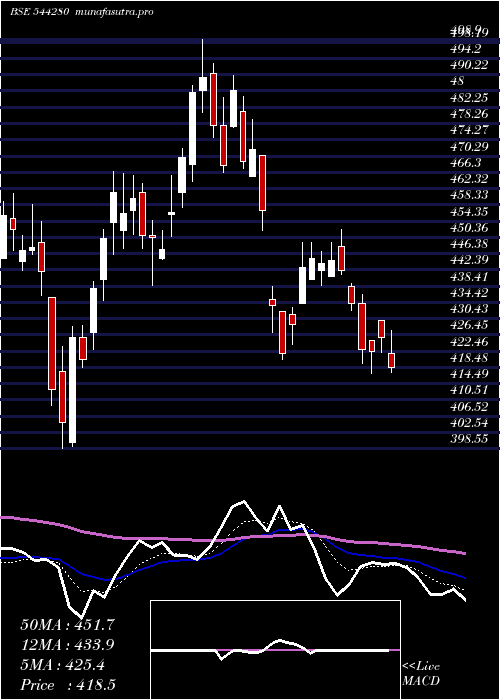
Daily price and volume Afcons Infrastructure
| Date |
Closing |
Open |
Range |
Volume |
Tue 21 October 2025 |
447.10 (0.06%) |
447.40 |
446.25 - 449.05 |
0.2339 times |
Mon 20 October 2025 |
446.85 (0.45%) |
444.90 |
443.00 - 448.30 |
0.6553 times |
Fri 17 October 2025 |
444.85 (-3.1%) |
459.00 |
444.05 - 459.00 |
0.4977 times |
Thu 16 October 2025 |
459.10 (0.45%) |
455.25 |
453.65 - 460.25 |
0.9233 times |
Wed 15 October 2025 |
457.05 (0.72%) |
450.45 |
450.45 - 459.75 |
0.5476 times |
Tue 14 October 2025 |
453.80 (-2.09%) |
461.10 |
451.75 - 465.05 |
0.9191 times |
Mon 13 October 2025 |
463.50 (0.04%) |
464.15 |
460.55 - 466.20 |
0.6801 times |
Fri 10 October 2025 |
463.30 (-0.47%) |
476.00 |
461.30 - 479.05 |
2.1941 times |
Thu 09 October 2025 |
465.50 (1.28%) |
452.20 |
452.20 - 469.00 |
2.0895 times |
Wed 08 October 2025 |
459.60 (1.64%) |
448.55 |
448.55 - 464.90 |
1.2594 times |
Tue 07 October 2025 |
452.20 (0.75%) |
446.05 |
446.05 - 453.60 |
1.3153 times |
Weekly price and charts AfconsInfrastructure Strong weekly Stock price targets for AfconsInfrastructure 544280 are 445.05 and 451.1 | Weekly Target 1 | 440.33 | | Weekly Target 2 | 443.72 | | Weekly Target 3 | 446.38333333333 | | Weekly Target 4 | 449.77 | | Weekly Target 5 | 452.43 |
Weekly price and volumes for Afcons Infrastructure
| Date |
Closing |
Open |
Range |
Volume |
Tue 21 October 2025 |
447.10 (0.51%) |
444.90 |
443.00 - 449.05 |
0.0995 times |
Fri 17 October 2025 |
444.85 (-3.98%) |
464.15 |
444.05 - 466.20 |
0.3992 times |
Fri 10 October 2025 |
463.30 (2.98%) |
449.35 |
444.05 - 479.05 |
0.889 times |
Fri 03 October 2025 |
449.90 (2.59%) |
434.25 |
434.25 - 460.60 |
0.4352 times |
Fri 26 September 2025 |
438.55 (-4.86%) |
467.70 |
437.00 - 467.70 |
0.3303 times |
Fri 19 September 2025 |
460.95 (2.8%) |
446.50 |
443.00 - 473.00 |
0.9288 times |
Fri 12 September 2025 |
448.40 (2.19%) |
438.65 |
435.30 - 456.05 |
0.7951 times |
Fri 05 September 2025 |
438.80 (5.08%) |
419.50 |
419.50 - 444.35 |
0.9558 times |
Fri 29 August 2025 |
417.60 (-3.1%) |
427.25 |
416.05 - 446.60 |
4.4248 times |
Fri 22 August 2025 |
430.95 (2.34%) |
421.55 |
421.55 - 436.65 |
0.7424 times |
Thu 14 August 2025 |
421.10 (3.52%) |
416.05 |
412.45 - 431.50 |
1.9413 times |

Monthly price and charts AfconsInfrastructure Strong monthly Stock price targets for AfconsInfrastructure 544280 are 427.03 and 463.08 | Monthly Target 1 | 420.33 | | Monthly Target 2 | 433.72 | | Monthly Target 3 | 456.38333333333 | | Monthly Target 4 | 469.77 | | Monthly Target 5 | 492.43 |
Monthly price and volumes Afcons Infrastructure
| Date |
Closing |
Open |
Range |
Volume |
Tue 21 October 2025 |
447.10 (-1.68%) |
448.30 |
443.00 - 479.05 |
0.2684 times |
Tue 30 September 2025 |
454.75 (8.9%) |
419.50 |
419.50 - 473.00 |
0.6027 times |
Fri 29 August 2025 |
417.60 (4.57%) |
396.55 |
396.55 - 446.60 |
1.4031 times |
Thu 31 July 2025 |
399.35 (-8.65%) |
437.25 |
390.10 - 440.95 |
1.3397 times |
Mon 30 June 2025 |
437.15 (3.26%) |
423.55 |
418.20 - 460.75 |
0.7637 times |
Fri 30 May 2025 |
423.35 (1.17%) |
418.75 |
406.75 - 472.45 |
1.8952 times |
Wed 30 April 2025 |
418.45 (-13.96%) |
481.30 |
416.85 - 484.95 |
0.3935 times |
Fri 28 March 2025 |
486.35 (17.77%) |
417.45 |
398.55 - 498.90 |
0.5569 times |
Fri 28 February 2025 |
412.95 (-12.77%) |
461.95 |
409.00 - 476.30 |
1.009 times |
Fri 31 January 2025 |
473.40 (-13.27%) |
547.85 |
436.50 - 570.00 |
1.7679 times |
Tue 31 December 2024 |
545.85 (8.38%) |
501.15 |
488.55 - 567.50 |
2.6889 times |

DMA SMA EMA moving averages of Afcons Infrastructure 544280
DMA (daily moving average) of Afcons Infrastructure 544280
| DMA period | DMA value | | 5 day DMA | 450.99 | | 12 day DMA | 455.14 | | 20 day DMA | 453.23 | | 35 day DMA | 450.43 | | 50 day DMA | 442.93 | | 100 day DMA | 434.22 | | 150 day DMA | 438.3 | | 200 day DMA | 448.31 | EMA (exponential moving average) of Afcons Infrastructure 544280
| EMA period | EMA current | EMA prev | EMA prev2 | | 5 day EMA | 450.06 | 451.54 | 453.88 | | 12 day EMA | 452.68 | 453.69 | 454.93 | | 20 day EMA | 452 | 452.52 | 453.12 | | 35 day EMA | 446.51 | 446.47 | 446.45 | | 50 day EMA | 440.66 | 440.4 | 440.14 |
SMA (simple moving average) of Afcons Infrastructure 544280
| SMA period | SMA current | SMA prev | SMA prev2 | | 5 day SMA | 450.99 | 452.33 | 455.66 | | 12 day SMA | 455.14 | 455.38 | 455.95 | | 20 day SMA | 453.23 | 453.8 | 454.5 | | 35 day SMA | 450.43 | 449.85 | 449.01 | | 50 day SMA | 442.93 | 442.17 | 441.29 | | 100 day SMA | 434.22 | 434.02 | 433.87 | | 150 day SMA | 438.3 | 438.12 | 437.98 | | 200 day SMA | 448.31 | 448.71 | 449.07 |
|
|
