GarudaConstruction 544271 full analysis,charts,indicators,moving averages,SMA,DMA,EMA,ADX,MACD,RSIGaruda Construction 544271 WideScreen charts, DMA,SMA,EMA technical analysis, forecast prediction, by indicators ADX,MACD,RSI,CCI BSE stock exchange
Daily price and charts and targets GarudaConstruction Strong Daily Stock price targets for GarudaConstruction 544271 are 197.38 and 201.93 | Daily Target 1 | 196.22 | | Daily Target 2 | 198.53 | | Daily Target 3 | 200.76666666667 | | Daily Target 4 | 203.08 | | Daily Target 5 | 205.32 |
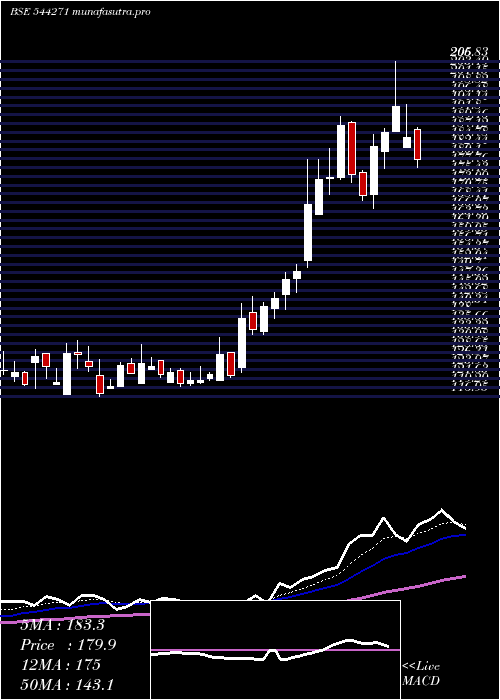
Daily price and volume Garuda Construction
| Date |
Closing |
Open |
Range |
Volume |
Tue 21 October 2025 |
200.85 (1.7%) |
201.45 |
198.45 - 203.00 |
0.2272 times |
Mon 20 October 2025 |
197.50 (5.9%) |
187.40 |
186.10 - 198.60 |
0.2914 times |
Fri 17 October 2025 |
186.50 (-0.96%) |
187.40 |
184.00 - 189.25 |
0.1666 times |
Thu 16 October 2025 |
188.30 (-0.63%) |
190.00 |
187.15 - 192.25 |
0.0793 times |
Wed 15 October 2025 |
189.50 (0.08%) |
192.10 |
188.55 - 192.10 |
0.1153 times |
Tue 14 October 2025 |
189.35 (-3.71%) |
196.70 |
186.80 - 197.45 |
0.2549 times |
Mon 13 October 2025 |
196.65 (-1.65%) |
199.85 |
194.60 - 199.85 |
0.2382 times |
Fri 10 October 2025 |
199.95 (1.45%) |
199.20 |
194.80 - 203.10 |
0.9897 times |
Thu 09 October 2025 |
197.10 (4.81%) |
192.95 |
192.00 - 209.30 |
7.4306 times |
Wed 08 October 2025 |
188.05 (-0.37%) |
189.60 |
182.20 - 191.15 |
0.2067 times |
Tue 07 October 2025 |
188.75 (1.67%) |
183.00 |
183.00 - 197.70 |
0.2434 times |
Weekly price and charts GarudaConstruction Strong weekly Stock price targets for GarudaConstruction 544271 are 193.48 and 210.38 | Weekly Target 1 | 179.75 | | Weekly Target 2 | 190.3 | | Weekly Target 3 | 196.65 | | Weekly Target 4 | 207.2 | | Weekly Target 5 | 213.55 |
Weekly price and volumes for Garuda Construction
| Date |
Closing |
Open |
Range |
Volume |
Tue 21 October 2025 |
200.85 (7.69%) |
187.40 |
186.10 - 203.00 |
0.1085 times |
Fri 17 October 2025 |
186.50 (-6.73%) |
199.85 |
184.00 - 199.85 |
0.1788 times |
Fri 10 October 2025 |
199.95 (5.4%) |
190.25 |
182.20 - 209.30 |
1.8814 times |
Fri 03 October 2025 |
189.70 (1.31%) |
188.65 |
176.90 - 193.80 |
0.3816 times |
Fri 26 September 2025 |
187.25 (-8.26%) |
206.50 |
183.80 - 206.50 |
0.4194 times |
Fri 19 September 2025 |
204.10 (0.29%) |
204.85 |
202.35 - 213.30 |
0.5654 times |
Fri 12 September 2025 |
203.50 (0.47%) |
204.55 |
197.00 - 220.00 |
1.4562 times |
Fri 05 September 2025 |
202.55 (-6.38%) |
217.50 |
199.45 - 229.90 |
1.3985 times |
Fri 29 August 2025 |
216.35 (12.86%) |
196.00 |
195.75 - 223.95 |
2.3628 times |
Fri 22 August 2025 |
191.70 (9.36%) |
176.20 |
176.20 - 204.80 |
1.2474 times |
Thu 14 August 2025 |
175.30 (3.51%) |
168.05 |
168.05 - 183.85 |
0.655 times |

Monthly price and charts GarudaConstruction Strong monthly Stock price targets for GarudaConstruction 544271 are 191 and 219.15 | Monthly Target 1 | 168.95 | | Monthly Target 2 | 184.9 | | Monthly Target 3 | 197.1 | | Monthly Target 4 | 213.05 | | Monthly Target 5 | 225.25 |
Monthly price and volumes Garuda Construction
| Date |
Closing |
Open |
Range |
Volume |
Tue 21 October 2025 |
200.85 (8.51%) |
181.15 |
181.15 - 209.30 |
0.5298 times |
Tue 30 September 2025 |
185.10 (-14.44%) |
217.50 |
176.90 - 229.90 |
0.9054 times |
Fri 29 August 2025 |
216.35 (16.44%) |
187.95 |
168.05 - 223.95 |
1.2557 times |
Thu 31 July 2025 |
185.80 (51.55%) |
120.65 |
119.50 - 206.00 |
3.7025 times |
Mon 30 June 2025 |
122.60 (6.68%) |
116.15 |
108.20 - 131.70 |
0.6279 times |
Fri 30 May 2025 |
114.92 (15.96%) |
100.35 |
87.62 - 117.76 |
0.3808 times |
Wed 30 April 2025 |
99.10 (-4.48%) |
103.70 |
98.30 - 117.85 |
0.1716 times |
Fri 28 March 2025 |
103.75 (-1.57%) |
106.00 |
99.90 - 116.30 |
0.2523 times |
Fri 28 February 2025 |
105.40 (-18.14%) |
125.00 |
102.50 - 135.80 |
0.6442 times |
Fri 31 January 2025 |
128.75 (-3.55%) |
133.05 |
116.10 - 153.50 |
1.5297 times |
Tue 31 December 2024 |
133.49 (49.07%) |
90.95 |
87.97 - 139.29 |
2.4978 times |

DMA SMA EMA moving averages of Garuda Construction 544271
DMA (daily moving average) of Garuda Construction 544271
| DMA period | DMA value | | 5 day DMA | 192.53 | | 12 day DMA | 192.35 | | 20 day DMA | 191.48 | | 35 day DMA | 197.33 | | 50 day DMA | 196.02 | | 100 day DMA | 168.63 | | 150 day DMA | 147.22 | | 200 day DMA | 141.11 | EMA (exponential moving average) of Garuda Construction 544271
| EMA period | EMA current | EMA prev | EMA prev2 | | 5 day EMA | 194.97 | 192.03 | 189.29 | | 12 day EMA | 193.34 | 191.98 | 190.98 | | 20 day EMA | 193.48 | 192.71 | 192.21 | | 35 day EMA | 193.22 | 192.77 | 192.49 | | 50 day EMA | 194.22 | 193.95 | 193.81 |
SMA (simple moving average) of Garuda Construction 544271
| SMA period | SMA current | SMA prev | SMA prev2 | | 5 day SMA | 192.53 | 190.23 | 190.06 | | 12 day SMA | 192.35 | 191.42 | 190.79 | | 20 day SMA | 191.48 | 191.28 | 191.61 | | 35 day SMA | 197.33 | 197.86 | 198.4 | | 50 day SMA | 196.02 | 195.46 | 194.99 | | 100 day SMA | 168.63 | 167.67 | 166.73 | | 150 day SMA | 147.22 | 146.59 | 145.97 | | 200 day SMA | 141.11 | 140.68 | 140.28 |
|
|
