SaraswatiSaree 544230 full analysis,charts,indicators,moving averages,SMA,DMA,EMA,ADX,MACD,RSISaraswati Saree 544230 WideScreen charts, DMA,SMA,EMA technical analysis, forecast prediction, by indicators ADX,MACD,RSI,CCI BSE stock exchange
Daily price and charts and targets SaraswatiSaree Strong Daily Stock price targets for SaraswatiSaree 544230 are 79.5 and 81.32 | Daily Target 1 | 79.06 | | Daily Target 2 | 79.93 | | Daily Target 3 | 80.88 | | Daily Target 4 | 81.75 | | Daily Target 5 | 82.7 |
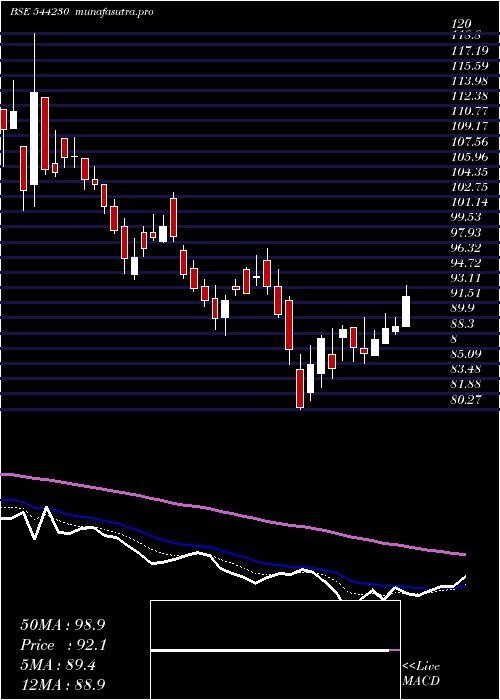
Daily price and volume Saraswati Saree
| Date |
Closing |
Open |
Range |
Volume |
Fri 05 December 2025 |
80.80 (0.87%) |
81.00 |
80.01 - 81.83 |
0.7127 times |
Thu 04 December 2025 |
80.10 (-0.73%) |
80.60 |
79.80 - 81.12 |
0.485 times |
Wed 03 December 2025 |
80.69 (0%) |
81.33 |
80.19 - 81.64 |
0.2959 times |
Tue 02 December 2025 |
80.69 (0.74%) |
80.32 |
80.31 - 82.86 |
0.4974 times |
Mon 01 December 2025 |
80.10 (-1.25%) |
81.79 |
80.00 - 82.06 |
0.7974 times |
Fri 28 November 2025 |
81.11 (0.23%) |
81.57 |
81.11 - 82.03 |
0.3778 times |
Thu 27 November 2025 |
80.92 (0.53%) |
82.00 |
79.85 - 82.05 |
2.8086 times |
Wed 26 November 2025 |
80.49 (-1.04%) |
81.99 |
80.10 - 82.99 |
2.6462 times |
Tue 25 November 2025 |
81.34 (0.47%) |
80.60 |
80.50 - 82.70 |
0.6897 times |
Mon 24 November 2025 |
80.96 (-1.51%) |
82.83 |
80.56 - 83.41 |
0.6893 times |
Fri 21 November 2025 |
82.20 (-1.23%) |
83.48 |
82.01 - 83.69 |
0.2342 times |
Weekly price and charts SaraswatiSaree Strong weekly Stock price targets for SaraswatiSaree 544230 are 78.77 and 81.83 | Weekly Target 1 | 78.09 | | Weekly Target 2 | 79.45 | | Weekly Target 3 | 81.153333333333 | | Weekly Target 4 | 82.51 | | Weekly Target 5 | 84.21 |
Weekly price and volumes for Saraswati Saree
| Date |
Closing |
Open |
Range |
Volume |
Fri 05 December 2025 |
80.80 (-0.38%) |
81.79 |
79.80 - 82.86 |
0.5025 times |
Fri 28 November 2025 |
81.11 (-1.33%) |
82.83 |
79.85 - 83.41 |
1.2997 times |
Fri 21 November 2025 |
82.20 (-1.05%) |
84.00 |
82.01 - 85.50 |
0.5818 times |
Fri 14 November 2025 |
83.07 (-0.61%) |
83.21 |
81.90 - 85.50 |
0.6166 times |
Fri 07 November 2025 |
83.58 (-1.26%) |
84.16 |
83.00 - 85.32 |
0.5025 times |
Fri 31 October 2025 |
84.65 (-2.69%) |
86.07 |
83.90 - 87.39 |
0.6466 times |
Thu 23 October 2025 |
86.99 (2.34%) |
84.11 |
84.11 - 87.00 |
0.3392 times |
Fri 17 October 2025 |
85.00 (-2.4%) |
87.17 |
84.02 - 87.48 |
0.8016 times |
Fri 10 October 2025 |
87.09 (-1.48%) |
90.00 |
85.15 - 90.00 |
1.3132 times |
Fri 03 October 2025 |
88.40 (2.22%) |
84.59 |
84.59 - 90.32 |
3.3963 times |
Fri 26 September 2025 |
86.48 (-3.61%) |
89.83 |
85.96 - 91.44 |
1.2309 times |

Monthly price and charts SaraswatiSaree Strong monthly Stock price targets for SaraswatiSaree 544230 are 78.77 and 81.83 | Monthly Target 1 | 78.09 | | Monthly Target 2 | 79.45 | | Monthly Target 3 | 81.153333333333 | | Monthly Target 4 | 82.51 | | Monthly Target 5 | 84.21 |
Monthly price and volumes Saraswati Saree
| Date |
Closing |
Open |
Range |
Volume |
Fri 05 December 2025 |
80.80 (-0.38%) |
81.79 |
79.80 - 82.86 |
0.0512 times |
Fri 28 November 2025 |
81.11 (-4.18%) |
84.16 |
79.85 - 85.50 |
0.3057 times |
Fri 31 October 2025 |
84.65 (-2.03%) |
87.20 |
83.90 - 90.32 |
0.6195 times |
Tue 30 September 2025 |
86.40 (-2.49%) |
91.00 |
84.59 - 91.50 |
0.8738 times |
Fri 29 August 2025 |
88.61 (-5.08%) |
94.35 |
88.04 - 98.17 |
1.2521 times |
Thu 31 July 2025 |
93.35 (-4.87%) |
99.00 |
92.30 - 102.24 |
0.8672 times |
Mon 30 June 2025 |
98.13 (3.38%) |
95.99 |
94.11 - 108.16 |
1.7725 times |
Fri 30 May 2025 |
94.92 (8.33%) |
89.00 |
82.20 - 99.00 |
1.1233 times |
Wed 30 April 2025 |
87.62 (8.93%) |
82.05 |
81.22 - 94.16 |
1.6135 times |
Fri 28 March 2025 |
80.44 (-18.91%) |
99.55 |
80.27 - 103.15 |
1.5211 times |
Fri 28 February 2025 |
99.20 (-15.18%) |
116.00 |
98.80 - 120.90 |
1.4129 times |

DMA SMA EMA moving averages of Saraswati Saree 544230
DMA (daily moving average) of Saraswati Saree 544230
| DMA period | DMA value | | 5 day DMA | 80.48 | | 12 day DMA | 81.05 | | 20 day DMA | 82.14 | | 35 day DMA | 83.54 | | 50 day DMA | 84.78 | | 100 day DMA | 88.71 | | 150 day DMA | 91.09 | | 200 day DMA | 92.75 | EMA (exponential moving average) of Saraswati Saree 544230
| EMA period | EMA current | EMA prev | EMA prev2 | | 5 day EMA | 80.63 | 80.55 | 80.78 | | 12 day EMA | 81.23 | 81.31 | 81.53 | | 20 day EMA | 82.03 | 82.16 | 82.38 | | 35 day EMA | 83.41 | 83.56 | 83.76 | | 50 day EMA | 84.75 | 84.91 | 85.11 |
SMA (simple moving average) of Saraswati Saree 544230
| SMA period | SMA current | SMA prev | SMA prev2 | | 5 day SMA | 80.48 | 80.54 | 80.7 | | 12 day SMA | 81.05 | 81.37 | 81.7 | | 20 day SMA | 82.14 | 82.32 | 82.54 | | 35 day SMA | 83.54 | 83.72 | 83.92 | | 50 day SMA | 84.78 | 84.96 | 85.16 | | 100 day SMA | 88.71 | 88.87 | 89.04 | | 150 day SMA | 91.09 | 91.14 | 91.21 | | 200 day SMA | 92.75 | 92.91 | 93.1 |
|
|
