AfcomHoldings 544224 full analysis,charts,indicators,moving averages,SMA,DMA,EMA,ADX,MACD,RSIAfcom Holdings 544224 WideScreen charts, DMA,SMA,EMA technical analysis, forecast prediction, by indicators ADX,MACD,RSI,CCI BSE stock exchange
Daily price and charts and targets AfcomHoldings Strong Daily Stock price targets for AfcomHoldings 544224 are 848.45 and 893.55 | Daily Target 1 | 813.87 | | Daily Target 2 | 837.93 | | Daily Target 3 | 858.96666666667 | | Daily Target 4 | 883.03 | | Daily Target 5 | 904.07 |
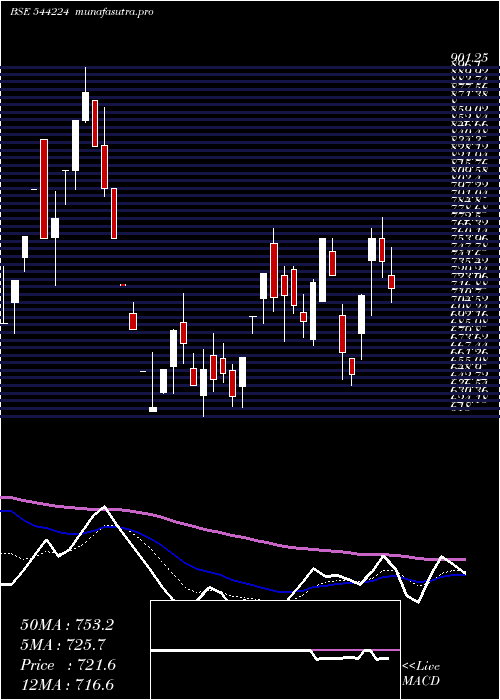
Daily price and volume Afcom Holdings
| Date |
Closing |
Open |
Range |
Volume |
Thu 23 October 2025 |
862.00 (3.13%) |
859.50 |
834.90 - 880.00 |
3.0053 times |
Tue 21 October 2025 |
835.85 (-0.42%) |
845.00 |
829.00 - 848.85 |
0.1289 times |
Mon 20 October 2025 |
839.40 (0.52%) |
836.00 |
827.30 - 845.00 |
0.2232 times |
Fri 17 October 2025 |
835.05 (1.71%) |
841.90 |
820.00 - 844.00 |
1.0971 times |
Thu 16 October 2025 |
821.05 (1.72%) |
820.00 |
809.00 - 850.00 |
1.3109 times |
Wed 15 October 2025 |
807.20 (0.43%) |
821.95 |
786.00 - 821.95 |
0.9494 times |
Tue 14 October 2025 |
803.75 (-1.45%) |
816.30 |
784.05 - 824.95 |
0.8991 times |
Mon 13 October 2025 |
815.60 (-1.84%) |
840.00 |
813.00 - 840.00 |
0.569 times |
Fri 10 October 2025 |
830.90 (-0.71%) |
826.05 |
826.00 - 845.00 |
0.635 times |
Thu 09 October 2025 |
836.85 (1.01%) |
825.00 |
813.00 - 859.00 |
1.182 times |
Wed 08 October 2025 |
828.50 (1.71%) |
816.00 |
816.00 - 865.00 |
1.575 times |
Weekly price and charts AfcomHoldings Strong weekly Stock price targets for AfcomHoldings 544224 are 844.65 and 897.35 | Weekly Target 1 | 803.73 | | Weekly Target 2 | 832.87 | | Weekly Target 3 | 856.43333333333 | | Weekly Target 4 | 885.57 | | Weekly Target 5 | 909.13 |
Weekly price and volumes for Afcom Holdings
| Date |
Closing |
Open |
Range |
Volume |
Thu 23 October 2025 |
862.00 (3.23%) |
836.00 |
827.30 - 880.00 |
0.4689 times |
Fri 17 October 2025 |
835.05 (0.5%) |
840.00 |
784.05 - 850.00 |
0.674 times |
Fri 10 October 2025 |
830.90 (-4.8%) |
872.80 |
813.00 - 903.95 |
1.0832 times |
Fri 03 October 2025 |
872.80 (0.5%) |
868.45 |
852.00 - 894.00 |
0.7701 times |
Fri 26 September 2025 |
868.45 (-1.13%) |
880.00 |
848.90 - 917.00 |
1.0301 times |
Fri 19 September 2025 |
878.40 (-4.97%) |
914.00 |
873.00 - 930.00 |
0.7903 times |
Fri 12 September 2025 |
924.30 (0.41%) |
917.20 |
917.20 - 987.40 |
0.9405 times |
Fri 05 September 2025 |
920.50 (-5.86%) |
995.70 |
892.55 - 997.00 |
0.8334 times |
Fri 29 August 2025 |
977.75 (11.56%) |
920.20 |
902.00 - 1013.60 |
1.6114 times |
Fri 22 August 2025 |
876.40 (-1.54%) |
900.00 |
840.00 - 929.00 |
1.798 times |
Thu 14 August 2025 |
890.10 (-0.5%) |
849.85 |
790.00 - 890.10 |
2.1115 times |

Monthly price and charts AfcomHoldings Strong monthly Stock price targets for AfcomHoldings 544224 are 763.08 and 882.98 | Monthly Target 1 | 730.1 | | Monthly Target 2 | 796.05 | | Monthly Target 3 | 850 | | Monthly Target 4 | 915.95 | | Monthly Target 5 | 969.9 |
Monthly price and volumes Afcom Holdings
| Date |
Closing |
Open |
Range |
Volume |
Thu 23 October 2025 |
862.00 (-1.49%) |
873.00 |
784.05 - 903.95 |
0.6755 times |
Tue 30 September 2025 |
875.05 (-10.5%) |
995.70 |
848.90 - 997.00 |
1.0217 times |
Fri 29 August 2025 |
977.75 (0.5%) |
973.60 |
790.00 - 1035.00 |
1.6414 times |
Thu 31 July 2025 |
972.85 (10.54%) |
890.00 |
772.05 - 1144.40 |
0.6763 times |
Mon 30 June 2025 |
880.05 (-12.07%) |
1005.00 |
799.95 - 1050.90 |
0.5357 times |
Fri 30 May 2025 |
1000.90 (46.03%) |
689.80 |
635.00 - 1000.90 |
1.1233 times |
Wed 30 April 2025 |
685.40 (-1.33%) |
680.00 |
642.60 - 779.80 |
0.5845 times |
Fri 28 March 2025 |
694.65 (-4.13%) |
701.25 |
618.00 - 770.35 |
1.1378 times |
Fri 28 February 2025 |
724.55 (-26.45%) |
924.00 |
685.00 - 939.80 |
1.2916 times |
Fri 31 January 2025 |
985.15 (7.04%) |
966.35 |
960.00 - 1268.95 |
1.3122 times |
Tue 31 December 2024 |
920.35 (38.48%) |
677.90 |
660.00 - 993.40 |
1.3174 times |

DMA SMA EMA moving averages of Afcom Holdings 544224
DMA (daily moving average) of Afcom Holdings 544224
| DMA period | DMA value | | 5 day DMA | 838.67 | | 12 day DMA | 827.56 | | 20 day DMA | 846.5 | | 35 day DMA | 877.92 | | 50 day DMA | 885.43 | | 100 day DMA | 905.93 | | 150 day DMA | 841.3 | | 200 day DMA | 860.98 | EMA (exponential moving average) of Afcom Holdings 544224
| EMA period | EMA current | EMA prev | EMA prev2 | | 5 day EMA | 841.53 | 831.29 | 829.01 | | 12 day EMA | 839.56 | 835.48 | 835.41 | | 20 day EMA | 848.69 | 847.29 | 848.49 | | 35 day EMA | 865.84 | 866.07 | 867.85 | | 50 day EMA | 886.89 | 887.91 | 890.03 |
SMA (simple moving average) of Afcom Holdings 544224
| SMA period | SMA current | SMA prev | SMA prev2 | | 5 day SMA | 838.67 | 827.71 | 821.29 | | 12 day SMA | 827.56 | 827.06 | 830.14 | | 20 day SMA | 846.5 | 848.17 | 849.66 | | 35 day SMA | 877.92 | 880.01 | 883.64 | | 50 day SMA | 885.43 | 886.09 | 888.2 | | 100 day SMA | 905.93 | 906.41 | 906.89 | | 150 day SMA | 841.3 | 839.93 | 838.52 | | 200 day SMA | 860.98 | 861.11 | 861.29 |
|
|
