EmcurePharmaceuticals 544210 full analysis,charts,indicators,moving averages,SMA,DMA,EMA,ADX,MACD,RSIEmcure Pharmaceuticals 544210 WideScreen charts, DMA,SMA,EMA technical analysis, forecast prediction, by indicators ADX,MACD,RSI,CCI BSE stock exchange
Daily price and charts and targets EmcurePharmaceuticals Strong Daily Stock price targets for EmcurePharmaceuticals 544210 are 1382.48 and 1409.88 | Daily Target 1 | 1360.92 | | Daily Target 2 | 1376.63 | | Daily Target 3 | 1388.3166666667 | | Daily Target 4 | 1404.03 | | Daily Target 5 | 1415.72 |
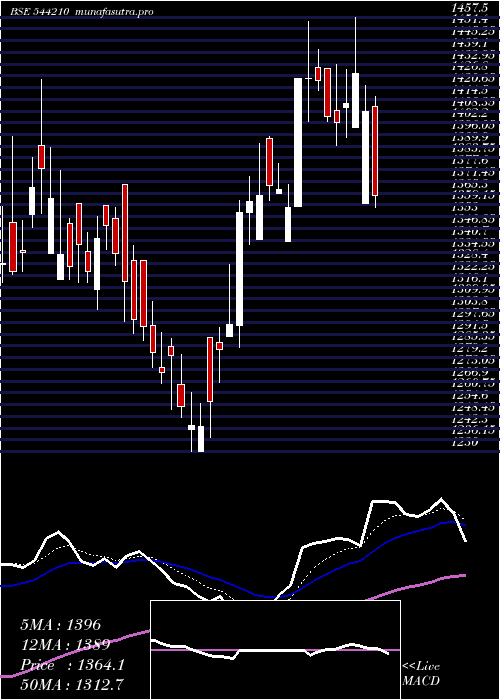
Daily price and volume Emcure Pharmaceuticals
| Date |
Closing |
Open |
Range |
Volume |
Tue 21 October 2025 |
1392.35 (1.15%) |
1381.75 |
1372.60 - 1400.00 |
0.8307 times |
Mon 20 October 2025 |
1376.50 (2.32%) |
1380.95 |
1341.20 - 1393.10 |
0.9797 times |
Fri 17 October 2025 |
1345.35 (-0.19%) |
1348.40 |
1339.00 - 1369.60 |
0.4026 times |
Thu 16 October 2025 |
1347.95 (-0.94%) |
1365.15 |
1339.80 - 1367.00 |
1.1786 times |
Wed 15 October 2025 |
1360.80 (1.58%) |
1341.00 |
1341.00 - 1372.15 |
1.9519 times |
Tue 14 October 2025 |
1339.60 (-2.17%) |
1370.60 |
1333.20 - 1390.00 |
0.7459 times |
Mon 13 October 2025 |
1369.30 (-3.6%) |
1405.20 |
1358.50 - 1421.10 |
0.9586 times |
Fri 10 October 2025 |
1420.45 (1.77%) |
1427.95 |
1382.75 - 1434.70 |
1.1459 times |
Thu 09 October 2025 |
1395.75 (0.88%) |
1383.00 |
1380.00 - 1415.55 |
1.1258 times |
Wed 08 October 2025 |
1383.55 (-2%) |
1393.00 |
1375.00 - 1415.00 |
0.6803 times |
Tue 07 October 2025 |
1411.85 (-1.58%) |
1434.45 |
1406.00 - 1434.45 |
1.3721 times |
Weekly price and charts EmcurePharmaceuticals Strong weekly Stock price targets for EmcurePharmaceuticals 544210 are 1366.78 and 1425.58 | Weekly Target 1 | 1319.05 | | Weekly Target 2 | 1355.7 | | Weekly Target 3 | 1377.85 | | Weekly Target 4 | 1414.5 | | Weekly Target 5 | 1436.65 |
Weekly price and volumes for Emcure Pharmaceuticals
| Date |
Closing |
Open |
Range |
Volume |
Tue 21 October 2025 |
1392.35 (3.49%) |
1380.95 |
1341.20 - 1400.00 |
0.2266 times |
Fri 17 October 2025 |
1345.35 (-5.29%) |
1405.20 |
1333.20 - 1421.10 |
0.6555 times |
Fri 10 October 2025 |
1420.45 (5.98%) |
1342.05 |
1342.05 - 1448.00 |
1.5636 times |
Fri 03 October 2025 |
1340.30 (4.36%) |
1309.95 |
1260.10 - 1345.40 |
1.8393 times |
Fri 26 September 2025 |
1284.30 (-4.34%) |
1340.00 |
1280.00 - 1345.15 |
0.9596 times |
Fri 19 September 2025 |
1342.50 (-0.4%) |
1350.00 |
1324.45 - 1384.95 |
0.7412 times |
Fri 12 September 2025 |
1347.85 (-1.8%) |
1403.85 |
1341.05 - 1403.85 |
0.8075 times |
Fri 05 September 2025 |
1372.60 (-1.38%) |
1424.95 |
1360.00 - 1424.95 |
0.8687 times |
Fri 29 August 2025 |
1391.80 (-6.83%) |
1494.20 |
1385.00 - 1508.55 |
0.9139 times |
Fri 22 August 2025 |
1493.85 (2.7%) |
1480.00 |
1427.00 - 1524.85 |
1.4241 times |
Thu 14 August 2025 |
1454.60 (5.04%) |
1428.95 |
1319.35 - 1498.00 |
1.1963 times |

Monthly price and charts EmcurePharmaceuticals Strong monthly Stock price targets for EmcurePharmaceuticals 544210 are 1328.73 and 1511.63 | Monthly Target 1 | 1185.58 | | Monthly Target 2 | 1288.97 | | Monthly Target 3 | 1368.4833333333 | | Monthly Target 4 | 1471.87 | | Monthly Target 5 | 1551.38 |
Monthly price and volumes Emcure Pharmaceuticals
| Date |
Closing |
Open |
Range |
Volume |
Tue 21 October 2025 |
1392.35 (8.79%) |
1265.10 |
1265.10 - 1448.00 |
0.2662 times |
Tue 30 September 2025 |
1279.90 (-8.04%) |
1424.95 |
1260.10 - 1424.95 |
0.3943 times |
Fri 29 August 2025 |
1391.80 (-1.16%) |
1410.60 |
1319.35 - 1524.85 |
0.4295 times |
Thu 31 July 2025 |
1408.15 (8.71%) |
1296.05 |
1230.00 - 1457.50 |
1.1134 times |
Mon 30 June 2025 |
1295.35 (-2.61%) |
1350.00 |
1288.05 - 1425.00 |
1.1926 times |
Fri 30 May 2025 |
1330.10 (30.17%) |
1022.55 |
950.00 - 1417.50 |
1.3804 times |
Wed 30 April 2025 |
1021.80 (-4.75%) |
1031.55 |
901.20 - 1103.35 |
1.4156 times |
Fri 28 March 2025 |
1072.80 (7.73%) |
975.20 |
911.75 - 1081.95 |
2.7727 times |
Fri 28 February 2025 |
995.80 (-18.98%) |
1220.00 |
942.45 - 1326.40 |
0.7663 times |
Fri 31 January 2025 |
1229.05 (-14.96%) |
1448.00 |
1110.00 - 1490.10 |
0.269 times |
Tue 31 December 2024 |
1445.20 (5.9%) |
1361.05 |
1337.00 - 1484.05 |
0.4456 times |

DMA SMA EMA moving averages of Emcure Pharmaceuticals 544210
DMA (daily moving average) of Emcure Pharmaceuticals 544210
| DMA period | DMA value | | 5 day DMA | 1364.59 | | 12 day DMA | 1381.5 | | 20 day DMA | 1352.11 | | 35 day DMA | 1354.89 | | 50 day DMA | 1381.2 | | 100 day DMA | 1363.78 | | 150 day DMA | 1256.62 | | 200 day DMA | 1250.72 | EMA (exponential moving average) of Emcure Pharmaceuticals 544210
| EMA period | EMA current | EMA prev | EMA prev2 | | 5 day EMA | 1372.58 | 1362.7 | 1355.8 | | 12 day EMA | 1366.74 | 1362.08 | 1359.46 | | 20 day EMA | 1364.12 | 1361.15 | 1359.53 | | 35 day EMA | 1372.52 | 1371.35 | 1371.05 | | 50 day EMA | 1381.7 | 1381.27 | 1381.46 |
SMA (simple moving average) of Emcure Pharmaceuticals 544210
| SMA period | SMA current | SMA prev | SMA prev2 | | 5 day SMA | 1364.59 | 1354.04 | 1352.6 | | 12 day SMA | 1381.5 | 1377.16 | 1371.24 | | 20 day SMA | 1352.11 | 1348.47 | 1346.77 | | 35 day SMA | 1354.89 | 1354.5 | 1354.94 | | 50 day SMA | 1381.2 | 1381.32 | 1382.22 | | 100 day SMA | 1363.78 | 1363.31 | 1363.14 | | 150 day SMA | 1256.62 | 1253.8 | 1250.9 | | 200 day SMA | 1250.72 | 1250.68 | 1250.64 |
|
|
