Afil 544200 full analysis,charts,indicators,moving averages,SMA,DMA,EMA,ADX,MACD,RSIAfil 544200 WideScreen charts, DMA,SMA,EMA technical analysis, forecast prediction, by indicators ADX,MACD,RSI,CCI BSE stock exchange
Daily price and charts and targets Afil Strong Daily Stock price targets for Afil 544200 are 6.9 and 7.09 | Daily Target 1 | 6.76 | | Daily Target 2 | 6.85 | | Daily Target 3 | 6.95 | | Daily Target 4 | 7.04 | | Daily Target 5 | 7.14 |
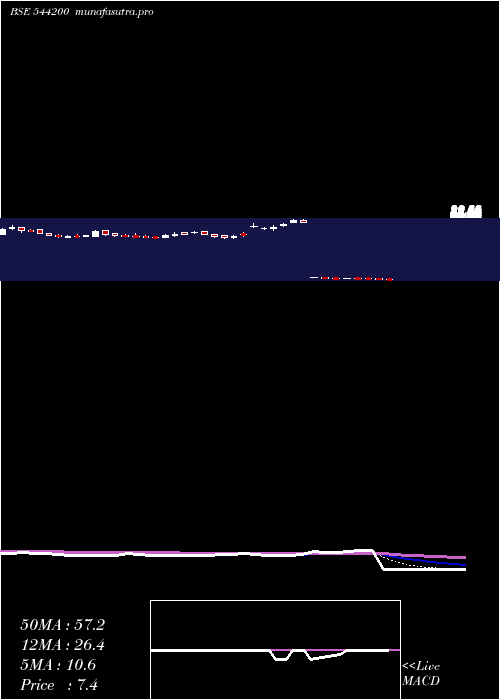
Daily price and volume Afil
| Date |
Closing |
Open |
Range |
Volume |
Tue 02 September 2025 |
6.94 (0.14%) |
6.86 |
6.86 - 7.05 |
0.8683 times |
Mon 01 September 2025 |
6.93 (-0.29%) |
6.95 |
6.88 - 7.05 |
0.7299 times |
Fri 29 August 2025 |
6.95 (0.29%) |
7.18 |
6.90 - 7.18 |
0.5927 times |
Thu 28 August 2025 |
6.93 (-1.14%) |
7.18 |
6.88 - 7.18 |
0.3036 times |
Tue 26 August 2025 |
7.01 (-2.64%) |
7.21 |
7.00 - 7.22 |
0.9055 times |
Mon 25 August 2025 |
7.20 (-0.14%) |
7.17 |
7.17 - 7.39 |
0.8654 times |
Fri 22 August 2025 |
7.21 (4.95%) |
6.98 |
6.85 - 7.55 |
2.3593 times |
Thu 21 August 2025 |
6.87 (-0.72%) |
6.87 |
6.86 - 7.05 |
1.3481 times |
Wed 20 August 2025 |
6.92 (-0.14%) |
6.83 |
6.74 - 6.96 |
1.3393 times |
Tue 19 August 2025 |
6.93 (-0.72%) |
6.99 |
6.39 - 7.00 |
0.688 times |
Mon 18 August 2025 |
6.98 (-0.57%) |
7.03 |
6.90 - 7.14 |
0.5261 times |
Weekly price and charts Afil Strong weekly Stock price targets for Afil 544200 are 6.81 and 7 | Weekly Target 1 | 6.76 | | Weekly Target 2 | 6.85 | | Weekly Target 3 | 6.95 | | Weekly Target 4 | 7.04 | | Weekly Target 5 | 7.14 |
Weekly price and volumes for Afil
| Date |
Closing |
Open |
Range |
Volume |
Tue 02 September 2025 |
6.94 (-0.14%) |
6.95 |
6.86 - 7.05 |
0.3014 times |
Fri 29 August 2025 |
6.95 (-3.61%) |
7.17 |
6.88 - 7.39 |
0.5029 times |
Fri 22 August 2025 |
7.21 (2.71%) |
7.03 |
6.39 - 7.55 |
1.1805 times |
Thu 14 August 2025 |
7.02 (1.45%) |
6.93 |
6.87 - 7.20 |
0.3076 times |
Fri 08 August 2025 |
6.92 (1.02%) |
6.90 |
6.73 - 7.29 |
0.6797 times |
Fri 01 August 2025 |
6.85 (-4.86%) |
7.36 |
6.81 - 7.60 |
1.2275 times |
Fri 25 July 2025 |
7.20 (-6.37%) |
7.95 |
7.15 - 7.95 |
1.0725 times |
Fri 18 July 2025 |
7.69 (5.49%) |
7.29 |
7.18 - 8.00 |
2.4498 times |
Fri 11 July 2025 |
7.29 (-2.15%) |
7.58 |
7.20 - 7.58 |
1.1302 times |
Fri 04 July 2025 |
7.45 (1.92%) |
7.23 |
7.23 - 7.87 |
1.1479 times |
Fri 27 June 2025 |
7.31 (-3.05%) |
7.30 |
6.94 - 7.96 |
1.2048 times |

Monthly price and charts Afil Strong monthly Stock price targets for Afil 544200 are 6.81 and 7 | Monthly Target 1 | 6.76 | | Monthly Target 2 | 6.85 | | Monthly Target 3 | 6.95 | | Monthly Target 4 | 7.04 | | Monthly Target 5 | 7.14 |
Monthly price and volumes Afil
| Date |
Closing |
Open |
Range |
Volume |
Tue 02 September 2025 |
6.94 (-0.14%) |
6.95 |
6.86 - 7.05 |
0.0965 times |
Fri 29 August 2025 |
6.95 (-0.71%) |
7.02 |
6.39 - 7.55 |
0.9599 times |
Thu 31 July 2025 |
7.00 (-8.26%) |
7.83 |
6.90 - 8.00 |
2.0082 times |
Mon 30 June 2025 |
7.63 (-4.86%) |
8.02 |
6.94 - 8.79 |
2.6894 times |
Fri 30 May 2025 |
8.02 (8.82%) |
7.25 |
6.52 - 8.48 |
2.0792 times |
Wed 30 April 2025 |
7.37 (-88.74%) |
65.00 |
7.32 - 90.58 |
0.8936 times |
Fri 28 March 2025 |
65.43 (-3.85%) |
67.89 |
63.75 - 75.11 |
0.3458 times |
Fri 28 February 2025 |
68.05 (-18.62%) |
81.10 |
65.67 - 85.99 |
0.1032 times |
Fri 31 January 2025 |
83.62 (-1.61%) |
76.05 |
72.20 - 90.40 |
0.498 times |
Tue 31 December 2024 |
84.99 (3.39%) |
82.30 |
80.70 - 110.38 |
0.3261 times |
Fri 29 November 2024 |
82.20 (-16.63%) |
100.60 |
80.00 - 101.46 |
0.0491 times |

DMA SMA EMA moving averages of Afil 544200
DMA (daily moving average) of Afil 544200
| DMA period | DMA value | | 5 day DMA | 6.95 | | 12 day DMA | 6.99 | | 20 day DMA | 6.98 | | 35 day DMA | 7.13 | | 50 day DMA | 7.22 | | 100 day DMA | 12.61 | | 150 day DMA | 33.23 | | 200 day DMA | 47.2 | EMA (exponential moving average) of Afil 544200
| EMA period | EMA current | EMA prev | EMA prev2 | | 5 day EMA | 6.97 | 6.98 | 7 | | 12 day EMA | 6.99 | 7 | 7.01 | | 20 day EMA | 7.03 | 7.04 | 7.05 | | 35 day EMA | 7.12 | 7.13 | 7.14 | | 50 day EMA | 7.25 | 7.26 | 7.27 |
SMA (simple moving average) of Afil 544200
| SMA period | SMA current | SMA prev | SMA prev2 | | 5 day SMA | 6.95 | 7 | 7.06 | | 12 day SMA | 6.99 | 7 | 7 | | 20 day SMA | 6.98 | 6.98 | 6.98 | | 35 day SMA | 7.13 | 7.14 | 7.15 | | 50 day SMA | 7.22 | 7.23 | 7.25 | | 100 day SMA | 12.61 | 13.21 | 13.79 | | 150 day SMA | 33.23 | 33.68 | 34.13 | | 200 day SMA | 47.2 | 47.66 | 48.12 |
|
|
