Indgn 544172 full analysis,charts,indicators,moving averages,SMA,DMA,EMA,ADX,MACD,RSIIndgn 544172 WideScreen charts, DMA,SMA,EMA technical analysis, forecast prediction, by indicators ADX,MACD,RSI,CCI BSE stock exchange
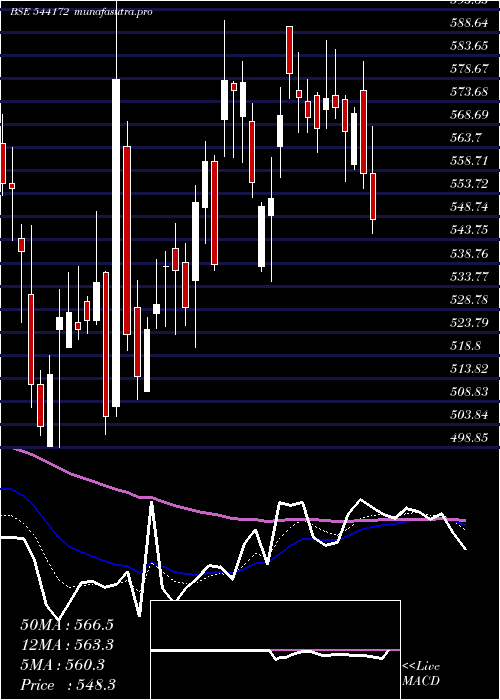
Daily price and charts and targets Indgn Strong Daily Stock price targets for Indgn 544172 are 539.6 and 550.35 | Daily Target 1 | 537.48 | | Daily Target 2 | 541.72 | | Daily Target 3 | 548.23333333333 | | Daily Target 4 | 552.47 | | Daily Target 5 | 558.98 |
Daily price and volume Indgn
| Date |
Closing |
Open |
Range |
Volume |
Thu 23 October 2025 |
545.95 (-1.59%) |
554.75 |
544.00 - 554.75 |
1.2691 times |
Tue 21 October 2025 |
554.75 (-0.34%) |
558.90 |
552.50 - 560.45 |
0.2129 times |
Mon 20 October 2025 |
556.65 (2.67%) |
533.05 |
533.05 - 561.90 |
2.0469 times |
Fri 17 October 2025 |
542.15 (0.58%) |
539.80 |
537.80 - 546.20 |
0.4957 times |
Thu 16 October 2025 |
539.00 (-0.64%) |
544.45 |
537.05 - 545.15 |
0.387 times |
Wed 15 October 2025 |
542.45 (1.88%) |
538.65 |
532.20 - 545.55 |
0.6935 times |
Tue 14 October 2025 |
532.45 (-2.86%) |
545.05 |
531.20 - 547.95 |
1.0047 times |
Mon 13 October 2025 |
548.15 (-1.56%) |
558.75 |
545.00 - 558.75 |
1.3858 times |
Fri 10 October 2025 |
556.85 (0.71%) |
553.00 |
549.45 - 558.00 |
0.7612 times |
Thu 09 October 2025 |
552.95 (0.43%) |
555.00 |
547.10 - 556.20 |
1.7431 times |
Wed 08 October 2025 |
550.60 (-0.44%) |
551.05 |
540.50 - 553.40 |
1.4206 times |
Weekly price and charts Indgn Strong weekly Stock price targets for Indgn 544172 are 539.5 and 568.35 | Weekly Target 1 | 518.12 | | Weekly Target 2 | 532.03 | | Weekly Target 3 | 546.96666666667 | | Weekly Target 4 | 560.88 | | Weekly Target 5 | 575.82 |
Weekly price and volumes for Indgn
| Date |
Closing |
Open |
Range |
Volume |
Thu 23 October 2025 |
545.95 (0.7%) |
533.05 |
533.05 - 561.90 |
0.4945 times |
Fri 17 October 2025 |
542.15 (-2.64%) |
558.75 |
531.20 - 558.75 |
0.5558 times |
Fri 10 October 2025 |
556.85 (-4.06%) |
586.85 |
540.50 - 586.85 |
0.9722 times |
Fri 03 October 2025 |
580.40 (0.85%) |
577.00 |
558.20 - 587.90 |
0.6416 times |
Fri 26 September 2025 |
575.50 (-1.9%) |
585.45 |
558.45 - 588.75 |
1.123 times |
Fri 19 September 2025 |
586.65 (1.93%) |
568.05 |
564.80 - 596.50 |
1.9816 times |
Fri 12 September 2025 |
575.55 (2.44%) |
559.15 |
548.00 - 576.50 |
1.2089 times |
Fri 05 September 2025 |
561.85 (3.55%) |
543.25 |
535.75 - 564.95 |
0.8163 times |
Fri 29 August 2025 |
542.60 (-5.18%) |
567.05 |
539.75 - 575.00 |
0.549 times |
Fri 22 August 2025 |
572.25 (-0.1%) |
578.40 |
568.90 - 593.00 |
1.6571 times |
Thu 14 August 2025 |
572.80 (0.36%) |
572.10 |
564.05 - 580.95 |
0.4857 times |
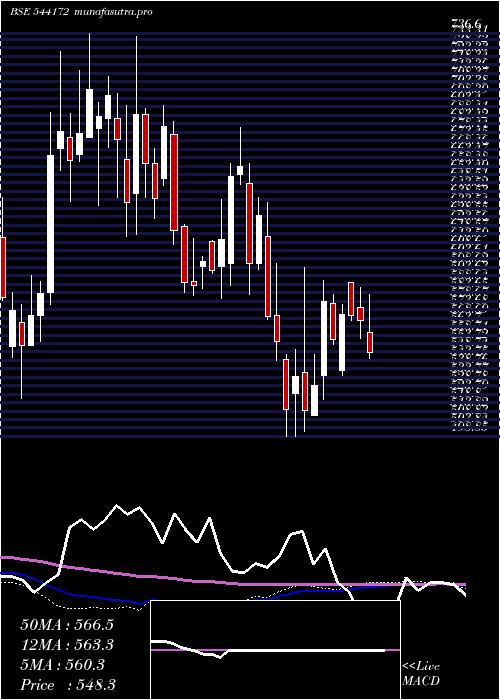
Monthly price and charts Indgn Strong monthly Stock price targets for Indgn 544172 are 510.23 and 566.93 | Monthly Target 1 | 498.32 | | Monthly Target 2 | 522.13 | | Monthly Target 3 | 555.01666666667 | | Monthly Target 4 | 578.83 | | Monthly Target 5 | 611.72 |
Monthly price and volumes Indgn
| Date |
Closing |
Open |
Range |
Volume |
Thu 23 October 2025 |
545.95 (-2.77%) |
561.50 |
531.20 - 587.90 |
0.1978 times |
Tue 30 September 2025 |
561.50 (3.48%) |
543.25 |
535.75 - 596.50 |
0.4527 times |
Fri 29 August 2025 |
542.60 (-0.22%) |
557.15 |
539.75 - 593.00 |
0.6338 times |
Thu 31 July 2025 |
543.80 (-5.34%) |
577.00 |
534.15 - 586.50 |
0.4052 times |
Mon 30 June 2025 |
574.50 (-4.21%) |
599.75 |
564.05 - 632.10 |
6.2266 times |
Fri 30 May 2025 |
599.75 (9.39%) |
549.60 |
529.20 - 621.00 |
0.2208 times |
Wed 30 April 2025 |
548.25 (-5.19%) |
577.60 |
534.70 - 589.90 |
0.2105 times |
Fri 28 March 2025 |
578.25 (12.38%) |
524.35 |
498.85 - 598.80 |
0.7808 times |
Fri 28 February 2025 |
514.55 (-14.38%) |
600.75 |
499.05 - 640.15 |
0.3158 times |
Fri 31 January 2025 |
600.95 (-0.51%) |
608.95 |
580.05 - 681.10 |
0.556 times |
Tue 31 December 2024 |
604.05 (-11.39%) |
676.90 |
582.05 - 684.55 |
3.4094 times |

DMA SMA EMA moving averages of Indgn 544172
DMA (daily moving average) of Indgn 544172
| DMA period | DMA value | | 5 day DMA | 547.7 | | 12 day DMA | 547.92 | | 20 day DMA | 557.29 | | 35 day DMA | 561.88 | | 50 day DMA | 563.58 | | 100 day DMA | 569.44 | | 150 day DMA | 567.79 | | 200 day DMA | 575.36 | EMA (exponential moving average) of Indgn 544172
| EMA period | EMA current | EMA prev | EMA prev2 | | 5 day EMA | 548.61 | 549.94 | 547.54 | | 12 day EMA | 550.98 | 551.9 | 551.38 | | 20 day EMA | 554.88 | 555.82 | 555.93 | | 35 day EMA | 558.79 | 559.55 | 559.83 | | 50 day EMA | 562.97 | 563.66 | 564.02 |
SMA (simple moving average) of Indgn 544172
| SMA period | SMA current | SMA prev | SMA prev2 | | 5 day SMA | 547.7 | 547 | 542.54 | | 12 day SMA | 547.92 | 550.03 | 552.17 | | 20 day SMA | 557.29 | 558.75 | 559.89 | | 35 day SMA | 561.88 | 561.9 | 561.66 | | 50 day SMA | 563.58 | 564.08 | 564.51 | | 100 day SMA | 569.44 | 569.87 | 570.2 | | 150 day SMA | 567.79 | 567.66 | 567.46 | | 200 day SMA | 575.36 | 575.58 | 575.75 |
|
|
