Faalcon 544164 full analysis,charts,indicators,moving averages,SMA,DMA,EMA,ADX,MACD,RSIFaalcon 544164 WideScreen charts, DMA,SMA,EMA technical analysis, forecast prediction, by indicators ADX,MACD,RSI,CCI BSE stock exchange
Daily price and charts and targets Faalcon Strong Daily Stock price targets for Faalcon 544164 are 45 and 47 | Daily Target 1 | 43.33 | | Daily Target 2 | 44.67 | | Daily Target 3 | 45.333333333333 | | Daily Target 4 | 46.67 | | Daily Target 5 | 47.33 |
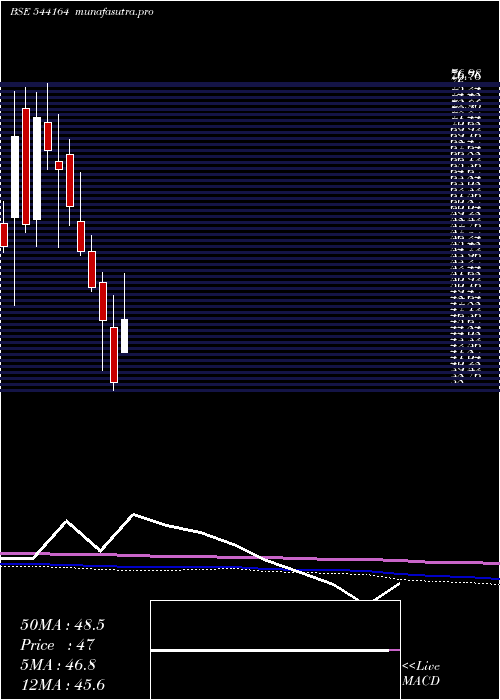
Daily price and volume Faalcon
| Date |
Closing |
Open |
Range |
Volume |
Mon 20 October 2025 |
46.00 (4.55%) |
44.00 |
44.00 - 46.00 |
2.7778 times |
Wed 15 October 2025 |
44.00 (0%) |
44.00 |
44.00 - 44.00 |
0.5556 times |
Mon 13 October 2025 |
44.00 (0%) |
44.00 |
44.00 - 44.00 |
0.5556 times |
Fri 10 October 2025 |
44.00 (4.76%) |
42.00 |
42.00 - 44.00 |
2.2222 times |
Thu 09 October 2025 |
42.00 (2.44%) |
42.00 |
42.00 - 42.00 |
0.5556 times |
Tue 07 October 2025 |
41.00 (-1.49%) |
41.00 |
41.00 - 41.00 |
0.5556 times |
Mon 06 October 2025 |
41.62 (-5.41%) |
42.90 |
41.62 - 42.90 |
1.1111 times |
Fri 03 October 2025 |
44.00 (-1.12%) |
44.00 |
44.00 - 44.00 |
0.5556 times |
Fri 26 September 2025 |
44.50 (-3.09%) |
44.50 |
44.50 - 44.50 |
0.5556 times |
Thu 25 September 2025 |
45.92 (-0.58%) |
45.92 |
45.92 - 45.92 |
0.5556 times |
Tue 23 September 2025 |
46.19 (1.58%) |
46.19 |
46.19 - 46.19 |
0.5556 times |

Weekly price and charts Faalcon Strong weekly Stock price targets for Faalcon 544164 are 45 and 47 | Weekly Target 1 | 43.33 | | Weekly Target 2 | 44.67 | | Weekly Target 3 | 45.333333333333 | | Weekly Target 4 | 46.67 | | Weekly Target 5 | 47.33 |
Weekly price and volumes for Faalcon
| Date |
Closing |
Open |
Range |
Volume |
Mon 20 October 2025 |
46.00 (4.55%) |
44.00 |
44.00 - 46.00 |
0.5618 times |
Wed 15 October 2025 |
44.00 (0%) |
44.00 |
44.00 - 44.00 |
0.2247 times |
Fri 10 October 2025 |
44.00 (0%) |
42.90 |
41.00 - 44.00 |
0.8989 times |
Fri 03 October 2025 |
44.00 (-1.12%) |
44.00 |
44.00 - 44.00 |
0.1124 times |
Fri 26 September 2025 |
44.50 (-7.68%) |
44.10 |
44.10 - 46.19 |
2.0225 times |
Fri 19 September 2025 |
48.20 (21.41%) |
41.01 |
41.01 - 54.99 |
3.3708 times |
Fri 12 September 2025 |
39.70 (-8.38%) |
43.33 |
39.10 - 45.45 |
1.236 times |
Fri 05 September 2025 |
43.33 (5.68%) |
42.40 |
42.40 - 43.33 |
0.8989 times |
Mon 25 August 2025 |
41.00 (2.5%) |
40.00 |
40.00 - 41.00 |
0.2247 times |
Fri 22 August 2025 |
40.00 (-2.46%) |
42.00 |
39.40 - 42.00 |
0.4494 times |
Fri 08 August 2025 |
41.01 (1.08%) |
40.57 |
40.57 - 42.71 |
0.4494 times |

Monthly price and charts Faalcon Strong monthly Stock price targets for Faalcon 544164 are 43.5 and 48.5 | Monthly Target 1 | 39.33 | | Monthly Target 2 | 42.67 | | Monthly Target 3 | 44.333333333333 | | Monthly Target 4 | 47.67 | | Monthly Target 5 | 49.33 |
Monthly price and volumes Faalcon
| Date |
Closing |
Open |
Range |
Volume |
Mon 20 October 2025 |
46.00 (3.37%) |
44.00 |
41.00 - 46.00 |
0.292 times |
Fri 26 September 2025 |
44.50 (8.54%) |
42.40 |
39.10 - 54.99 |
1.2226 times |
Mon 25 August 2025 |
41.00 (1.06%) |
40.57 |
39.40 - 42.71 |
0.1825 times |
Thu 31 July 2025 |
40.57 (-7.8%) |
44.00 |
39.31 - 45.90 |
0.8394 times |
Mon 30 June 2025 |
44.00 (-14.05%) |
49.95 |
37.60 - 61.75 |
1.4781 times |
Fri 30 May 2025 |
51.19 (6.69%) |
45.10 |
42.25 - 59.10 |
0.9854 times |
Wed 30 April 2025 |
47.98 (23.03%) |
42.80 |
42.80 - 52.90 |
0.7482 times |
Fri 28 March 2025 |
39.00 (-16.83%) |
46.00 |
38.00 - 50.00 |
1.7701 times |
Fri 28 February 2025 |
46.89 (-8.2%) |
51.71 |
40.55 - 53.00 |
1.0949 times |
Fri 31 January 2025 |
51.08 (-8.29%) |
55.70 |
50.55 - 57.70 |
1.3869 times |
Tue 31 December 2024 |
55.70 (-9.3%) |
59.50 |
55.17 - 65.73 |
2.1898 times |
DMA SMA EMA moving averages of Faalcon 544164
DMA (daily moving average) of Faalcon 544164
| DMA period | DMA value | | 5 day DMA | 44 | | 12 day DMA | 44.06 | | 20 day DMA | 44.11 | | 35 day DMA | 43.2 | | 50 day DMA | 43.89 | | 100 day DMA | 45.2 | | 150 day DMA | 48.62 | | 200 day DMA | 53.01 | EMA (exponential moving average) of Faalcon 544164
| EMA period | EMA current | EMA prev | EMA prev2 | | 5 day EMA | 44.39 | 43.59 | 43.38 | | 12 day EMA | 44.02 | 43.66 | 43.6 | | 20 day EMA | 43.93 | 43.71 | 43.68 | | 35 day EMA | 44.32 | 44.22 | 44.23 | | 50 day EMA | 44.43 | 44.37 | 44.38 |
SMA (simple moving average) of Faalcon 544164
| SMA period | SMA current | SMA prev | SMA prev2 | | 5 day SMA | 44 | 43 | 42.52 | | 12 day SMA | 44.06 | 44.24 | 44.83 | | 20 day SMA | 44.11 | 43.86 | 43.66 | | 35 day SMA | 43.2 | 43.07 | 43 | | 50 day SMA | 43.89 | 43.92 | 44.07 | | 100 day SMA | 45.2 | 45.21 | 45.23 | | 150 day SMA | 48.62 | 48.72 | 48.84 | | 200 day SMA | 53.01 | 53.11 | 53.22 |
|
|
