Liquidadd 544159 full analysis,charts,indicators,moving averages,SMA,DMA,EMA,ADX,MACD,RSILiquidadd 544159 WideScreen charts, DMA,SMA,EMA technical analysis, forecast prediction, by indicators ADX,MACD,RSI,CCI BSE stock exchange
Daily price and charts and targets Liquidadd Strong Daily Stock price targets for Liquidadd 544159 are 1096.44 and 1096.44 | Daily Target 1 | 1096.44 | | Daily Target 2 | 1096.44 | | Daily Target 3 | 1096.44 | | Daily Target 4 | 1096.44 | | Daily Target 5 | 1096.44 |
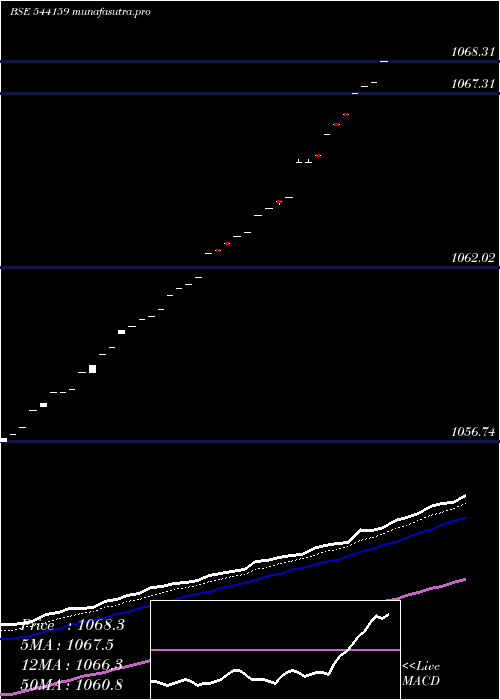
Daily price and volume Liquidadd
| Date |
Closing |
Open |
Range |
Volume |
Tue 21 October 2025 |
1096.44 (0%) |
1096.44 |
1096.44 - 1096.44 |
0.0897 times |
Mon 20 October 2025 |
1096.44 (0.04%) |
1096.44 |
1096.44 - 1096.46 |
0.2756 times |
Fri 17 October 2025 |
1095.99 (0.04%) |
1095.98 |
1095.97 - 1095.99 |
1.0616 times |
Thu 16 October 2025 |
1095.52 (0.01%) |
1095.51 |
1095.51 - 1095.53 |
0.663 times |
Wed 15 October 2025 |
1095.37 (0.01%) |
1095.37 |
1095.36 - 1095.37 |
0.163 times |
Tue 14 October 2025 |
1095.23 (0.02%) |
1095.22 |
1095.21 - 1095.23 |
1.7133 times |
Mon 13 October 2025 |
1095.06 (0.01%) |
1095.08 |
1095.06 - 1095.08 |
0.1816 times |
Fri 10 October 2025 |
1094.90 (0.04%) |
1094.90 |
1094.89 - 1094.92 |
3.1597 times |
Thu 09 October 2025 |
1094.43 (0.01%) |
1094.45 |
1094.43 - 1094.45 |
1.6045 times |
Wed 08 October 2025 |
1094.30 (0.01%) |
1094.28 |
1094.28 - 1094.30 |
1.0879 times |
Tue 07 October 2025 |
1094.14 (0.01%) |
1094.14 |
1094.13 - 1094.16 |
1.7436 times |
Weekly price and charts Liquidadd Strong weekly Stock price targets for Liquidadd 544159 are 1096.43 and 1096.45 | Weekly Target 1 | 1096.43 | | Weekly Target 2 | 1096.43 | | Weekly Target 3 | 1096.4466666667 | | Weekly Target 4 | 1096.45 | | Weekly Target 5 | 1096.47 |
Weekly price and volumes for Liquidadd
| Date |
Closing |
Open |
Range |
Volume |
Tue 21 October 2025 |
1096.44 (0.04%) |
1096.44 |
1096.44 - 1096.46 |
0.0388 times |
Fri 17 October 2025 |
1095.99 (0.1%) |
1095.08 |
1095.06 - 1095.99 |
0.4021 times |
Fri 10 October 2025 |
1094.90 (0.1%) |
1093.99 |
1093.99 - 1094.92 |
1.8604 times |
Fri 03 October 2025 |
1093.86 (0.1%) |
1092.94 |
1092.94 - 1093.86 |
1.1429 times |
Fri 26 September 2025 |
1092.79 (0.1%) |
1091.87 |
1091.85 - 1092.81 |
2.53 times |
Fri 19 September 2025 |
1091.70 (0.1%) |
1090.79 |
1090.79 - 1091.72 |
0.3433 times |
Fri 12 September 2025 |
1090.63 (0.08%) |
1089.74 |
1089.74 - 1090.65 |
1.0522 times |
Fri 05 September 2025 |
1089.74 (0.11%) |
1088.70 |
1088.70 - 1089.76 |
0.4508 times |
Fri 29 August 2025 |
1088.56 (0.1%) |
1087.64 |
1087.64 - 1088.57 |
0.4617 times |
Fri 22 August 2025 |
1087.50 (0.1%) |
1086.57 |
1086.57 - 1087.51 |
1.7179 times |
Thu 14 August 2025 |
1086.43 (0.1%) |
1085.53 |
1085.51 - 1086.44 |
0.5733 times |

Monthly price and charts Liquidadd Strong monthly Stock price targets for Liquidadd 544159 are 1094.92 and 1097.99 | Monthly Target 1 | 1092.36 | | Monthly Target 2 | 1094.4 | | Monthly Target 3 | 1095.43 | | Monthly Target 4 | 1097.47 | | Monthly Target 5 | 1098.5 |
Monthly price and volumes Liquidadd
| Date |
Closing |
Open |
Range |
Volume |
Tue 21 October 2025 |
1096.44 (0.3%) |
1093.41 |
1093.39 - 1096.46 |
0.4102 times |
Tue 30 September 2025 |
1093.11 (0.42%) |
1088.70 |
1088.70 - 1093.12 |
0.6124 times |
Fri 29 August 2025 |
1088.56 (0.43%) |
1084.30 |
1078.90 - 1088.57 |
0.626 times |
Thu 31 July 2025 |
1083.88 (0.42%) |
1079.44 |
1079.44 - 1090.00 |
3.2307 times |
Mon 30 June 2025 |
1079.31 (0.4%) |
1075.19 |
1075.17 - 1079.31 |
1.287 times |
Fri 30 May 2025 |
1075.01 (0.46%) |
1070.57 |
1070.55 - 1075.03 |
0.8204 times |
Wed 30 April 2025 |
1070.08 (0.45%) |
1065.23 |
1065.23 - 1075.00 |
0.2011 times |
Fri 28 March 2025 |
1065.24 (0.49%) |
1060.22 |
1060.20 - 1065.25 |
0.5868 times |
Fri 28 February 2025 |
1060.04 (0.46%) |
1055.39 |
1055.39 - 1060.04 |
0.756 times |
Fri 31 January 2025 |
1055.19 (0.56%) |
1049.47 |
1049.47 - 1055.21 |
1.4695 times |
Tue 31 December 2024 |
1049.30 (0.52%) |
1044.08 |
1044.08 - 1049.32 |
0.2196 times |

DMA SMA EMA moving averages of Liquidadd 544159
DMA (daily moving average) of Liquidadd 544159
| DMA period | DMA value | | 5 day DMA | 1095.95 | | 12 day DMA | 1095.15 | | 20 day DMA | 1094.22 | | 35 day DMA | 1092.57 | | 50 day DMA | 1090.89 | | 100 day DMA | 1085.39 | | 150 day DMA | 1079.61 | | 200 day DMA | 1073.31 | EMA (exponential moving average) of Liquidadd 544159
| EMA period | EMA current | EMA prev | EMA prev2 | | 5 day EMA | 1095.99 | 1095.77 | 1095.44 | | 12 day EMA | 1095.16 | 1094.93 | 1094.65 | | 20 day EMA | 1094.25 | 1094.02 | 1093.77 | | 35 day EMA | 1092.57 | 1092.34 | 1092.1 | | 50 day EMA | 1090.89 | 1090.66 | 1090.42 |
SMA (simple moving average) of Liquidadd 544159
| SMA period | SMA current | SMA prev | SMA prev2 | | 5 day SMA | 1095.95 | 1095.71 | 1095.43 | | 12 day SMA | 1095.15 | 1094.94 | 1094.68 | | 20 day SMA | 1094.22 | 1093.99 | 1093.76 | | 35 day SMA | 1092.57 | 1092.35 | 1092.12 | | 50 day SMA | 1090.89 | 1090.66 | 1090.42 | | 100 day SMA | 1085.39 | 1085.17 | 1084.95 | | 150 day SMA | 1079.61 | 1079.37 | 1079.13 | | 200 day SMA | 1073.31 | 1073.07 | 1072.83 |
|
|
