Harshdeep 544105 full analysis,charts,indicators,moving averages,SMA,DMA,EMA,ADX,MACD,RSIHarshdeep 544105 WideScreen charts, DMA,SMA,EMA technical analysis, forecast prediction, by indicators ADX,MACD,RSI,CCI BSE stock exchange
Daily price and charts and targets Harshdeep Strong Daily Stock price targets for Harshdeep 544105 are 99.5 and 100.5 | Daily Target 1 | 98.67 | | Daily Target 2 | 99.33 | | Daily Target 3 | 99.666666666667 | | Daily Target 4 | 100.33 | | Daily Target 5 | 100.67 |
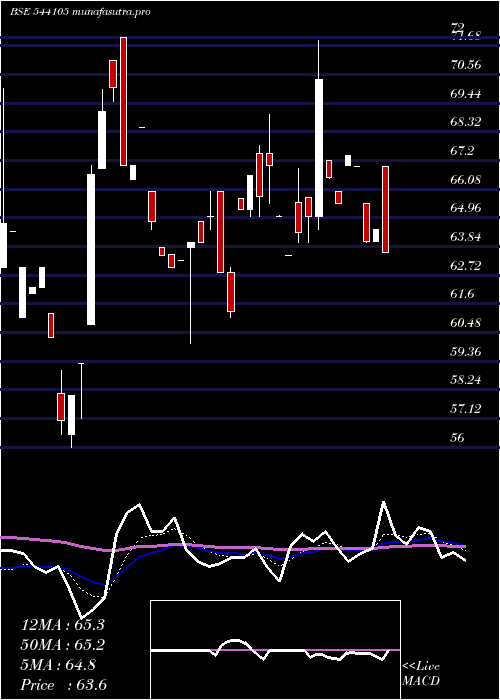
Daily price and volume Harshdeep
| Date |
Closing |
Open |
Range |
Volume |
Thu 23 October 2025 |
100.00 (0.2%) |
100.00 |
99.00 - 100.00 |
0.4444 times |
Tue 21 October 2025 |
99.80 (2.36%) |
99.79 |
99.79 - 99.80 |
0.2222 times |
Mon 20 October 2025 |
97.50 (1.37%) |
99.50 |
97.45 - 99.50 |
0.4444 times |
Fri 17 October 2025 |
96.18 (-3.82%) |
98.70 |
95.00 - 98.70 |
2.6667 times |
Thu 16 October 2025 |
100.00 (0.96%) |
100.01 |
100.00 - 100.01 |
0.3333 times |
Wed 15 October 2025 |
99.05 (0.05%) |
100.00 |
98.51 - 100.00 |
1.2222 times |
Tue 14 October 2025 |
99.00 (2.22%) |
97.05 |
97.00 - 99.00 |
2 times |
Mon 13 October 2025 |
96.85 (0.34%) |
96.64 |
96.58 - 97.90 |
1.6667 times |
Fri 10 October 2025 |
96.52 (0.01%) |
96.52 |
96.52 - 96.52 |
0.1111 times |
Thu 09 October 2025 |
96.51 (1.27%) |
95.40 |
95.40 - 98.00 |
0.8889 times |
Wed 08 October 2025 |
95.30 (-2.76%) |
95.69 |
95.30 - 95.70 |
0.8889 times |
Weekly price and charts Harshdeep Strong weekly Stock price targets for Harshdeep 544105 are 98.73 and 101.28 | Weekly Target 1 | 96.6 | | Weekly Target 2 | 98.3 | | Weekly Target 3 | 99.15 | | Weekly Target 4 | 100.85 | | Weekly Target 5 | 101.7 |
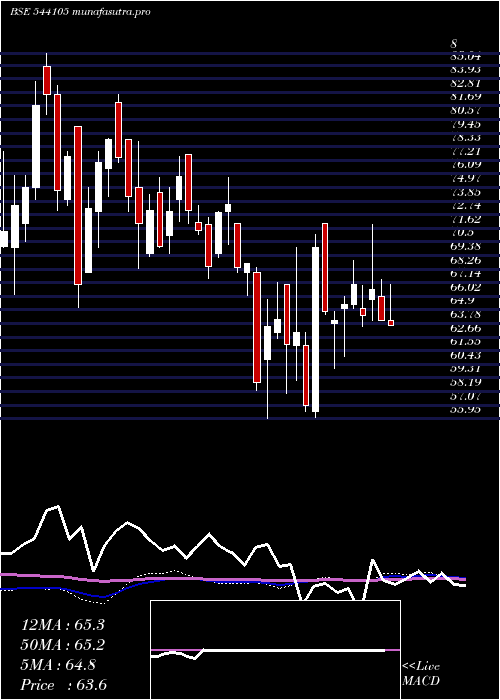
Weekly price and volumes for Harshdeep
| Date |
Closing |
Open |
Range |
Volume |
Thu 23 October 2025 |
100.00 (3.97%) |
99.50 |
97.45 - 100.00 |
0.303 times |
Fri 17 October 2025 |
96.18 (-0.35%) |
96.64 |
95.00 - 100.01 |
2.1515 times |
Fri 10 October 2025 |
96.52 (1.6%) |
95.00 |
93.10 - 98.00 |
0.697 times |
Fri 03 October 2025 |
95.00 (-1.55%) |
96.30 |
93.25 - 98.01 |
0.6364 times |
Fri 26 September 2025 |
96.50 (-8.92%) |
101.20 |
95.75 - 102.50 |
0.6364 times |
Fri 19 September 2025 |
105.95 (1.88%) |
104.15 |
100.15 - 108.00 |
0.9394 times |
Fri 12 September 2025 |
104.00 (-2.35%) |
105.00 |
103.00 - 110.00 |
0.4848 times |
Fri 05 September 2025 |
106.50 (-3.66%) |
110.00 |
105.05 - 111.00 |
1.6364 times |
Fri 29 August 2025 |
110.55 (-1.38%) |
113.10 |
110.50 - 116.00 |
1.2121 times |
Fri 22 August 2025 |
112.10 (6.21%) |
105.55 |
105.00 - 112.50 |
1.303 times |
Tue 12 August 2025 |
105.55 (4.5%) |
101.00 |
101.00 - 106.00 |
0.4242 times |
Monthly price and charts Harshdeep Strong monthly Stock price targets for Harshdeep 544105 are 96.55 and 103.46 | Monthly Target 1 | 90.79 | | Monthly Target 2 | 95.4 | | Monthly Target 3 | 97.703333333333 | | Monthly Target 4 | 102.31 | | Monthly Target 5 | 104.61 |
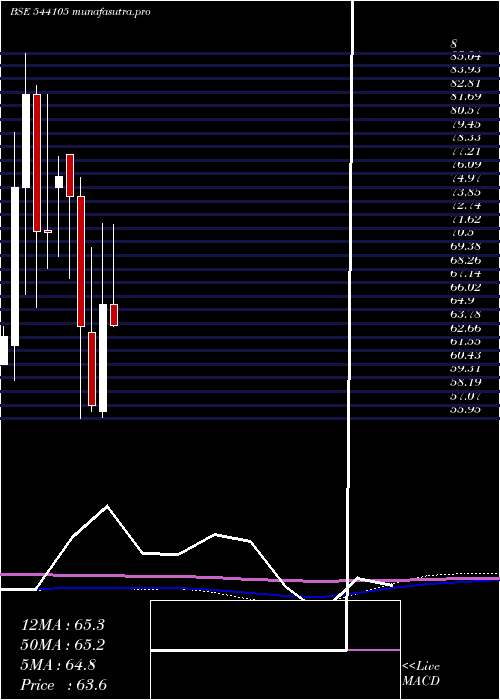
Monthly price and volumes Harshdeep
| Date |
Closing |
Open |
Range |
Volume |
Thu 23 October 2025 |
100.00 (3.84%) |
98.00 |
93.10 - 100.01 |
0.4382 times |
Tue 30 September 2025 |
96.30 (-12.89%) |
110.00 |
95.75 - 111.00 |
0.4949 times |
Fri 29 August 2025 |
110.55 (0.18%) |
115.85 |
96.90 - 116.00 |
0.6082 times |
Thu 31 July 2025 |
110.35 (17.54%) |
93.00 |
89.81 - 110.35 |
1.0616 times |
Mon 30 June 2025 |
93.88 (25.42%) |
75.00 |
73.05 - 100.00 |
2.1232 times |
Fri 30 May 2025 |
74.85 (17.69%) |
64.00 |
64.00 - 82.50 |
1.8852 times |
Wed 30 April 2025 |
63.60 (-2.6%) |
65.30 |
63.50 - 71.90 |
0.4231 times |
Fri 28 March 2025 |
65.30 (14.46%) |
56.50 |
56.00 - 72.00 |
0.8765 times |
Fri 28 February 2025 |
57.05 (-10.16%) |
63.00 |
56.50 - 70.00 |
0.816 times |
Fri 31 January 2025 |
63.50 (-14.48%) |
74.25 |
55.95 - 75.75 |
1.2731 times |
Tue 31 December 2024 |
74.25 (-2.19%) |
77.69 |
67.50 - 77.69 |
1.3185 times |
DMA SMA EMA moving averages of Harshdeep 544105
DMA (daily moving average) of Harshdeep 544105
| DMA period | DMA value | | 5 day DMA | 98.7 | | 12 day DMA | 97.89 | | 20 day DMA | 97.83 | | 35 day DMA | 101.12 | | 50 day DMA | 103.39 | | 100 day DMA | 96.97 | | 150 day DMA | 87.2 | | 200 day DMA | 81.82 | EMA (exponential moving average) of Harshdeep 544105
| EMA period | EMA current | EMA prev | EMA prev2 | | 5 day EMA | 98.94 | 98.41 | 97.71 | | 12 day EMA | 98.49 | 98.22 | 97.93 | | 20 day EMA | 99.04 | 98.94 | 98.85 | | 35 day EMA | 100.84 | 100.89 | 100.95 | | 50 day EMA | 103.22 | 103.35 | 103.49 |
SMA (simple moving average) of Harshdeep 544105
| SMA period | SMA current | SMA prev | SMA prev2 | | 5 day SMA | 98.7 | 98.51 | 98.35 | | 12 day SMA | 97.89 | 97.48 | 97.08 | | 20 day SMA | 97.83 | 97.93 | 98 | | 35 day SMA | 101.12 | 101.35 | 101.66 | | 50 day SMA | 103.39 | 103.43 | 103.47 | | 100 day SMA | 96.97 | 96.75 | 96.56 | | 150 day SMA | 87.2 | 86.92 | 86.64 | | 200 day SMA | 81.82 | 81.67 | 81.52 |
|
|
