Sunitatool 544001 full analysis,charts,indicators,moving averages,SMA,DMA,EMA,ADX,MACD,RSISunitatool 544001 WideScreen charts, DMA,SMA,EMA technical analysis, forecast prediction, by indicators ADX,MACD,RSI,CCI BSE stock exchange
Daily price and charts and targets Sunitatool Strong Daily Stock price targets for Sunitatool 544001 are 608.5 and 633.5 | Daily Target 1 | 589 | | Daily Target 2 | 603 | | Daily Target 3 | 614 | | Daily Target 4 | 628 | | Daily Target 5 | 639 |
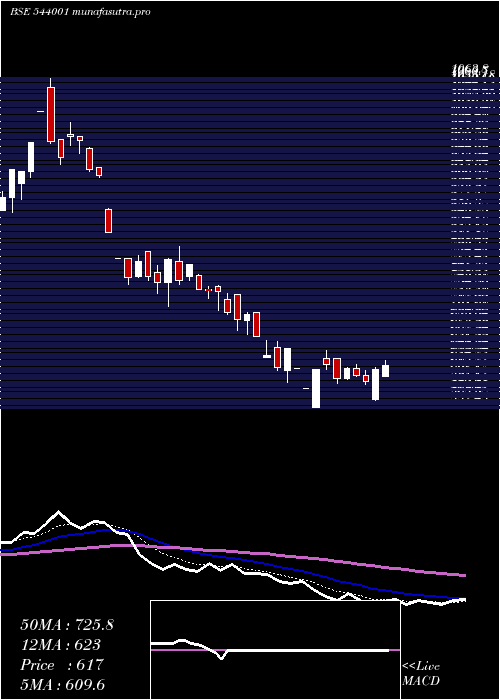
Daily price and volume Sunitatool
| Date |
Closing |
Open |
Range |
Volume |
Fri 23 May 2025 |
617.00 (0.95%) |
601.00 |
600.00 - 625.00 |
0.328 times |
Thu 22 May 2025 |
611.20 (3.02%) |
564.00 |
563.65 - 615.00 |
1.0106 times |
Wed 21 May 2025 |
593.30 (-1.45%) |
602.00 |
588.00 - 610.00 |
0.4656 times |
Tue 20 May 2025 |
602.00 (-1.79%) |
612.35 |
600.00 - 619.00 |
0.1587 times |
Mon 19 May 2025 |
613.00 (2.69%) |
596.95 |
595.00 - 614.50 |
0.254 times |
Fri 16 May 2025 |
596.95 (-3.66%) |
628.00 |
590.00 - 628.00 |
1.4603 times |
Thu 15 May 2025 |
619.65 (1.49%) |
628.90 |
611.10 - 641.05 |
1.0847 times |
Wed 14 May 2025 |
610.55 (5%) |
552.45 |
552.45 - 610.55 |
4.709 times |
Tue 13 May 2025 |
581.50 (-5%) |
581.50 |
581.50 - 581.50 |
0.1481 times |
Mon 12 May 2025 |
612.10 (-5%) |
612.10 |
612.10 - 612.10 |
0.381 times |
Fri 09 May 2025 |
644.30 (4.99%) |
610.20 |
590.65 - 644.30 |
0.6931 times |
Weekly price and charts Sunitatool Strong weekly Stock price targets for Sunitatool 544001 are 590.33 and 651.68 | Weekly Target 1 | 540.53 | | Weekly Target 2 | 578.77 | | Weekly Target 3 | 601.88333333333 | | Weekly Target 4 | 640.12 | | Weekly Target 5 | 663.23 |
Weekly price and volumes for Sunitatool
| Date |
Closing |
Open |
Range |
Volume |
Fri 23 May 2025 |
617.00 (3.36%) |
596.95 |
563.65 - 625.00 |
0.6827 times |
Fri 16 May 2025 |
596.95 (-7.35%) |
612.10 |
552.45 - 641.05 |
2.3969 times |
Fri 09 May 2025 |
644.30 (-6.46%) |
688.00 |
590.65 - 699.95 |
1.3182 times |
Fri 02 May 2025 |
688.80 (-6.44%) |
736.00 |
672.30 - 742.00 |
0.6485 times |
Fri 25 April 2025 |
736.25 (-1.41%) |
746.75 |
710.00 - 802.00 |
1.4958 times |
Thu 17 April 2025 |
746.75 (-0.95%) |
756.00 |
730.00 - 795.00 |
0.5084 times |
Fri 11 April 2025 |
753.90 (-17.48%) |
860.05 |
744.25 - 862.05 |
0.8506 times |
Fri 04 April 2025 |
913.65 (-6.2%) |
974.05 |
910.00 - 974.05 |
0.3943 times |
Fri 28 March 2025 |
974.05 (0.94%) |
1013.15 |
930.00 - 1063.80 |
1.1178 times |
Fri 21 March 2025 |
964.95 (1.58%) |
988.00 |
855.60 - 988.00 |
0.5866 times |
Thu 13 March 2025 |
949.90 (21.16%) |
823.00 |
821.00 - 949.90 |
0.5866 times |

Monthly price and charts Sunitatool Strong monthly Stock price targets for Sunitatool 544001 are 496.95 and 672.5 | Monthly Target 1 | 456.93 | | Monthly Target 2 | 536.97 | | Monthly Target 3 | 632.48333333333 | | Monthly Target 4 | 712.52 | | Monthly Target 5 | 808.03 |
Monthly price and volumes Sunitatool
| Date |
Closing |
Open |
Range |
Volume |
Fri 23 May 2025 |
617.00 (-11.9%) |
728.00 |
552.45 - 728.00 |
1.4581 times |
Wed 30 April 2025 |
700.35 (-28.1%) |
974.05 |
696.50 - 974.05 |
1.1997 times |
Fri 28 March 2025 |
974.05 (43.63%) |
650.10 |
630.00 - 1063.80 |
0.8896 times |
Fri 28 February 2025 |
678.15 (-26.93%) |
891.40 |
678.15 - 973.35 |
0.6077 times |
Fri 31 January 2025 |
928.10 (15.49%) |
787.55 |
787.55 - 1038.60 |
0.8269 times |
Tue 31 December 2024 |
803.60 (49.41%) |
537.85 |
527.10 - 848.90 |
0.7852 times |
Fri 29 November 2024 |
537.85 (18.72%) |
450.00 |
442.50 - 613.70 |
0.8123 times |
Thu 31 October 2024 |
453.05 (-21.29%) |
574.00 |
401.20 - 605.00 |
1.5202 times |
Mon 30 September 2024 |
575.60 (-7.31%) |
601.05 |
552.90 - 710.00 |
0.9188 times |
Fri 30 August 2024 |
621.00 (-22.15%) |
758.00 |
612.85 - 817.40 |
0.9815 times |
Wed 31 July 2024 |
797.70 (26.6%) |
634.00 |
630.00 - 939.95 |
1.4993 times |

DMA SMA EMA moving averages of Sunitatool 544001
DMA (daily moving average) of Sunitatool 544001
| DMA period | DMA value | | 5 day DMA | 607.3 | | 12 day DMA | 609.6 | | 20 day DMA | 645.02 | | 35 day DMA | 729.63 | | 50 day DMA | 764.91 | | 100 day DMA | 819.08 | | 150 day DMA | 727.81 | | 200 day DMA | 718.08 | EMA (exponential moving average) of Sunitatool 544001
| EMA period | EMA current | EMA prev | EMA prev2 | | 5 day EMA | 609.6 | 605.9 | 603.25 | | 12 day EMA | 622.92 | 624 | 626.33 | | 20 day EMA | 649.94 | 653.41 | 657.85 | | 35 day EMA | 695.39 | 700 | 705.23 | | 50 day EMA | 747.92 | 753.26 | 759.06 |
SMA (simple moving average) of Sunitatool 544001
| SMA period | SMA current | SMA prev | SMA prev2 | | 5 day SMA | 607.3 | 603.29 | 604.98 | | 12 day SMA | 609.6 | 610.88 | 615.14 | | 20 day SMA | 645.02 | 652.92 | 659.87 | | 35 day SMA | 729.63 | 740.95 | 751.06 | | 50 day SMA | 764.91 | 766.13 | 768.18 | | 100 day SMA | 819.08 | 819.68 | 820.02 | | 150 day SMA | 727.81 | 727.73 | 727.68 | | 200 day SMA | 718.08 | 718.86 | 719.56 |
|
|
