Techkgreen 543991 full analysis,charts,indicators,moving averages,SMA,DMA,EMA,ADX,MACD,RSITechkgreen 543991 WideScreen charts, DMA,SMA,EMA technical analysis, forecast prediction, by indicators ADX,MACD,RSI,CCI BSE stock exchange
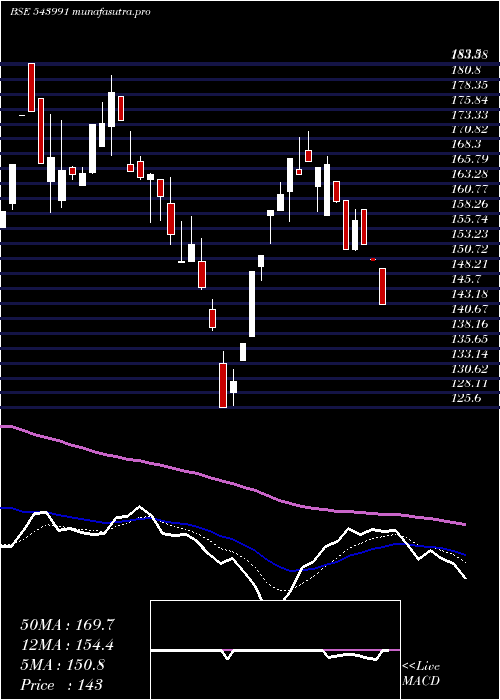
Daily price and charts and targets Techkgreen Strong Daily Stock price targets for Techkgreen 543991 are 158.75 and 165.4 | Daily Target 1 | 153.82 | | Daily Target 2 | 157.03 | | Daily Target 3 | 160.46666666667 | | Daily Target 4 | 163.68 | | Daily Target 5 | 167.12 |
Daily price and volume Techkgreen
| Date |
Closing |
Open |
Range |
Volume |
Tue 21 October 2025 |
160.25 (0.16%) |
160.00 |
157.25 - 163.90 |
0.4444 times |
Mon 20 October 2025 |
160.00 (4.4%) |
153.25 |
153.25 - 162.60 |
1.7222 times |
Fri 17 October 2025 |
153.25 (-0.39%) |
153.85 |
150.00 - 158.85 |
1.1667 times |
Thu 16 October 2025 |
153.85 (-4.38%) |
156.00 |
152.10 - 157.00 |
1.1111 times |
Wed 15 October 2025 |
160.90 (3.64%) |
159.10 |
154.00 - 161.00 |
1.1111 times |
Tue 14 October 2025 |
155.25 (-2.97%) |
158.25 |
154.00 - 159.60 |
1 times |
Mon 13 October 2025 |
160.00 (-1.51%) |
159.00 |
155.00 - 160.05 |
0.8333 times |
Fri 10 October 2025 |
162.45 (0.22%) |
164.80 |
161.30 - 164.80 |
0.5 times |
Thu 09 October 2025 |
162.10 (-2.93%) |
165.20 |
162.10 - 166.55 |
0.8889 times |
Wed 08 October 2025 |
167.00 (-1.15%) |
169.00 |
164.00 - 173.15 |
1.2222 times |
Tue 07 October 2025 |
168.95 (-1.17%) |
167.55 |
165.00 - 168.95 |
0.6111 times |
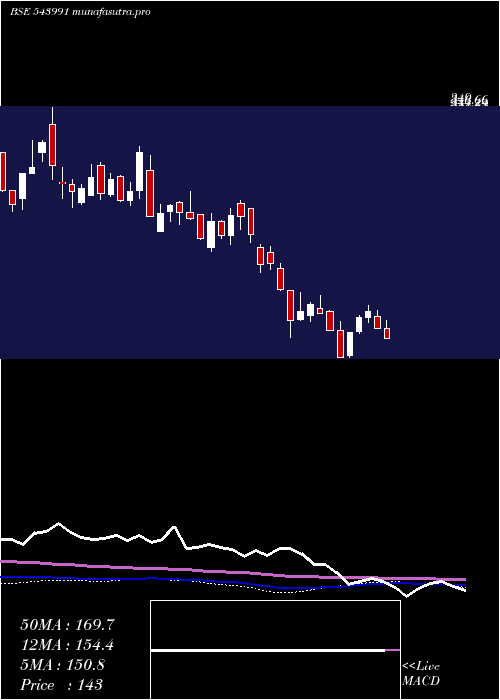
Weekly price and charts Techkgreen Strong weekly Stock price targets for Techkgreen 543991 are 156.75 and 167.4 | Weekly Target 1 | 148.48 | | Weekly Target 2 | 154.37 | | Weekly Target 3 | 159.13333333333 | | Weekly Target 4 | 165.02 | | Weekly Target 5 | 169.78 |
Weekly price and volumes for Techkgreen
| Date |
Closing |
Open |
Range |
Volume |
Tue 21 October 2025 |
160.25 (4.57%) |
153.25 |
153.25 - 163.90 |
0.3794 times |
Fri 17 October 2025 |
153.25 (-5.66%) |
159.00 |
150.00 - 161.00 |
0.9144 times |
Fri 10 October 2025 |
162.45 (-1.55%) |
165.00 |
161.30 - 173.15 |
0.8171 times |
Fri 03 October 2025 |
165.00 (0%) |
160.50 |
157.45 - 166.05 |
0.5545 times |
Fri 26 September 2025 |
165.00 (-13%) |
186.00 |
161.00 - 186.00 |
0.9436 times |
Fri 19 September 2025 |
189.65 (21.34%) |
156.60 |
156.60 - 194.05 |
2.6946 times |
Fri 12 September 2025 |
156.30 (-4.7%) |
165.65 |
155.00 - 165.65 |
1.2938 times |
Fri 05 September 2025 |
164.00 (1.27%) |
164.90 |
154.00 - 165.50 |
0.5739 times |
Fri 29 August 2025 |
161.95 (5.75%) |
160.80 |
152.00 - 165.25 |
0.856 times |
Fri 22 August 2025 |
153.15 (-8.4%) |
174.00 |
151.00 - 174.30 |
0.9728 times |
Thu 14 August 2025 |
167.20 (10%) |
144.40 |
144.40 - 167.20 |
0.9436 times |
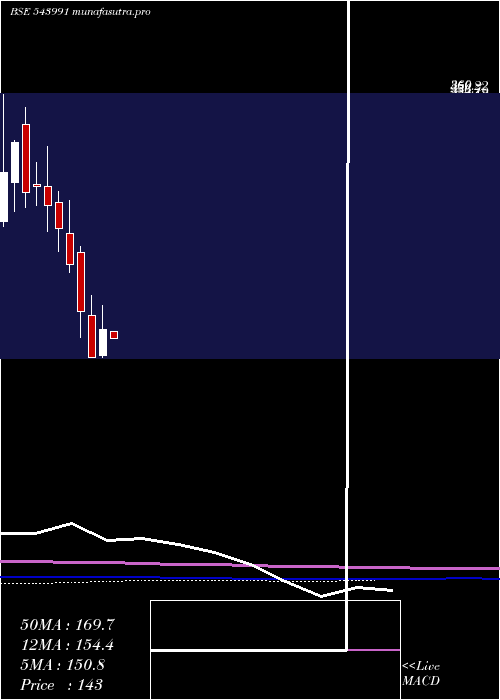
Monthly price and charts Techkgreen Strong monthly Stock price targets for Techkgreen 543991 are 155.13 and 178.28 | Monthly Target 1 | 137.98 | | Monthly Target 2 | 149.12 | | Monthly Target 3 | 161.13333333333 | | Monthly Target 4 | 172.27 | | Monthly Target 5 | 184.28 |
Monthly price and volumes Techkgreen
| Date |
Closing |
Open |
Range |
Volume |
Tue 21 October 2025 |
160.25 (0.16%) |
160.00 |
150.00 - 173.15 |
0.5741 times |
Tue 30 September 2025 |
160.00 (-1.2%) |
164.90 |
154.00 - 194.05 |
1.2596 times |
Fri 29 August 2025 |
161.95 (-12.39%) |
185.10 |
144.40 - 185.10 |
0.7968 times |
Thu 31 July 2025 |
184.85 (2.75%) |
179.50 |
169.40 - 197.85 |
0.4628 times |
Mon 30 June 2025 |
179.90 (16.82%) |
146.50 |
143.00 - 189.95 |
0.8732 times |
Fri 30 May 2025 |
154.00 (2.33%) |
149.00 |
137.25 - 177.50 |
0.8077 times |
Wed 30 April 2025 |
150.50 (19.68%) |
128.15 |
126.00 - 172.00 |
0.4169 times |
Fri 28 March 2025 |
125.75 (-24.59%) |
163.60 |
125.60 - 181.50 |
1.742 times |
Fri 28 February 2025 |
166.75 (-20.22%) |
219.45 |
143.70 - 225.00 |
1.3774 times |
Fri 31 January 2025 |
209.00 (-13.28%) |
236.60 |
201.90 - 266.10 |
1.6896 times |
Tue 31 December 2024 |
241.00 (-7.87%) |
264.00 |
220.05 - 274.00 |
2.5715 times |
DMA SMA EMA moving averages of Techkgreen 543991
DMA (daily moving average) of Techkgreen 543991
| DMA period | DMA value | | 5 day DMA | 157.65 | | 12 day DMA | 161.25 | | 20 day DMA | 163.13 | | 35 day DMA | 164.34 | | 50 day DMA | 162.55 | | 100 day DMA | 166.63 | | 150 day DMA | 163.16 | | 200 day DMA | 176.1 | EMA (exponential moving average) of Techkgreen 543991
| EMA period | EMA current | EMA prev | EMA prev2 | | 5 day EMA | 158.58 | 157.75 | 156.63 | | 12 day EMA | 160.28 | 160.28 | 160.33 | | 20 day EMA | 161.88 | 162.05 | 162.27 | | 35 day EMA | 162.36 | 162.48 | 162.63 | | 50 day EMA | 162.87 | 162.98 | 163.1 |
SMA (simple moving average) of Techkgreen 543991
| SMA period | SMA current | SMA prev | SMA prev2 | | 5 day SMA | 157.65 | 156.65 | 156.65 | | 12 day SMA | 161.25 | 161.64 | 161.49 | | 20 day SMA | 163.13 | 164.13 | 165.61 | | 35 day SMA | 164.34 | 164.35 | 164.41 | | 50 day SMA | 162.55 | 162.54 | 162.61 | | 100 day SMA | 166.63 | 166.72 | 166.73 | | 150 day SMA | 163.16 | 163.19 | 163.24 | | 200 day SMA | 176.1 | 176.46 | 176.88 |
|
|
