Southwest 543986 full analysis,charts,indicators,moving averages,SMA,DMA,EMA,ADX,MACD,RSISouthwest 543986 WideScreen charts, DMA,SMA,EMA technical analysis, forecast prediction, by indicators ADX,MACD,RSI,CCI BSE stock exchange
Daily price and charts and targets Southwest Strong Daily Stock price targets for Southwest 543986 are 194.15 and 213.55 | Daily Target 1 | 177.98 | | Daily Target 2 | 190.92 | | Daily Target 3 | 197.38333333333 | | Daily Target 4 | 210.32 | | Daily Target 5 | 216.78 |
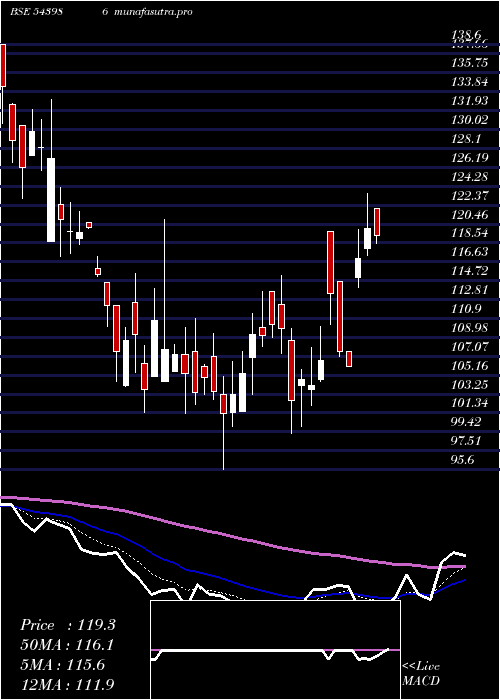
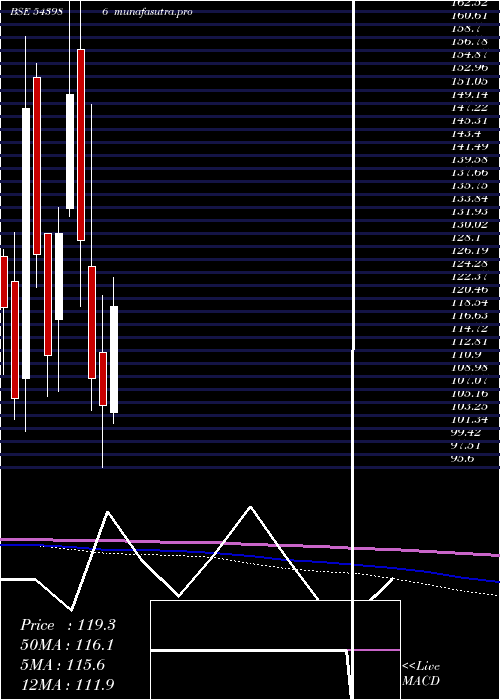
Daily price and volume Southwest
| Date |
Closing |
Open |
Range |
Volume |
Fri 05 December 2025 |
203.85 (5%) |
187.80 |
184.45 - 203.85 |
0.399 times |
Thu 04 December 2025 |
194.15 (-4.99%) |
198.90 |
194.15 - 199.95 |
0.7423 times |
Wed 03 December 2025 |
204.35 (-5%) |
223.00 |
204.35 - 223.00 |
0.4529 times |
Tue 02 December 2025 |
215.10 (-4.12%) |
225.00 |
212.05 - 225.00 |
0.8025 times |
Mon 01 December 2025 |
224.35 (5.9%) |
223.55 |
218.00 - 242.55 |
3.8603 times |
Fri 28 November 2025 |
211.85 (8.75%) |
196.25 |
194.80 - 214.00 |
1.4971 times |
Thu 27 November 2025 |
194.80 (2.55%) |
193.00 |
193.00 - 204.10 |
0.653 times |
Wed 26 November 2025 |
189.95 (-2.06%) |
194.95 |
187.20 - 195.00 |
0.2858 times |
Tue 25 November 2025 |
193.95 (4.78%) |
185.40 |
184.30 - 194.60 |
0.9663 times |
Mon 24 November 2025 |
185.10 (-4.17%) |
196.35 |
184.35 - 196.35 |
0.3408 times |
Fri 21 November 2025 |
193.15 (0.68%) |
196.00 |
188.35 - 197.00 |
0.3218 times |
Weekly price and charts Southwest Strong weekly Stock price targets for Southwest 543986 are 165.1 and 223.2 | Weekly Target 1 | 152.18 | | Weekly Target 2 | 178.02 | | Weekly Target 3 | 210.28333333333 | | Weekly Target 4 | 236.12 | | Weekly Target 5 | 268.38 |
Weekly price and volumes for Southwest
| Date |
Closing |
Open |
Range |
Volume |
Fri 05 December 2025 |
203.85 (-3.78%) |
223.55 |
184.45 - 242.55 |
2.2055 times |
Fri 28 November 2025 |
211.85 (9.68%) |
196.35 |
184.30 - 214.00 |
1.3193 times |
Fri 21 November 2025 |
193.15 (6.86%) |
205.10 |
188.35 - 205.10 |
1.3066 times |
Fri 14 November 2025 |
180.75 (4.3%) |
187.20 |
177.70 - 197.35 |
0.7593 times |
Fri 07 November 2025 |
173.30 (9.72%) |
155.05 |
155.05 - 184.50 |
1.6637 times |
Fri 31 October 2025 |
157.95 (13.71%) |
143.60 |
140.80 - 171.65 |
2.5398 times |
Thu 23 October 2025 |
138.90 (8.98%) |
127.15 |
127.15 - 139.40 |
0.0449 times |
Fri 17 October 2025 |
127.45 (-0.66%) |
132.90 |
120.55 - 135.00 |
0.0471 times |
Fri 10 October 2025 |
128.30 (-0.81%) |
132.55 |
125.00 - 134.00 |
0.0722 times |
Fri 03 October 2025 |
129.35 (-0.88%) |
133.25 |
128.20 - 135.15 |
0.0416 times |
Fri 26 September 2025 |
130.50 (-8.07%) |
149.95 |
130.30 - 149.95 |
0.1702 times |

Monthly price and charts Southwest Strong monthly Stock price targets for Southwest 543986 are 165.1 and 223.2 | Monthly Target 1 | 152.18 | | Monthly Target 2 | 178.02 | | Monthly Target 3 | 210.28333333333 | | Monthly Target 4 | 236.12 | | Monthly Target 5 | 268.38 |
Monthly price and volumes Southwest
| Date |
Closing |
Open |
Range |
Volume |
Fri 05 December 2025 |
203.85 (-3.78%) |
223.55 |
184.45 - 242.55 |
1.1606 times |
Fri 28 November 2025 |
211.85 (34.12%) |
155.05 |
155.05 - 214.00 |
2.6569 times |
Fri 31 October 2025 |
157.95 (19.61%) |
134.15 |
120.55 - 171.65 |
1.4363 times |
Tue 30 September 2025 |
132.05 (-5.95%) |
143.00 |
130.30 - 155.80 |
0.4736 times |
Fri 29 August 2025 |
140.40 (2.15%) |
141.25 |
126.40 - 152.40 |
0.4362 times |
Thu 31 July 2025 |
137.45 (-7.5%) |
151.60 |
131.00 - 154.95 |
0.2828 times |
Mon 30 June 2025 |
148.60 (5.28%) |
142.85 |
139.20 - 162.60 |
1.1452 times |
Fri 30 May 2025 |
141.15 (12.51%) |
125.45 |
108.00 - 164.25 |
1.326 times |
Wed 30 April 2025 |
125.45 (19.82%) |
103.70 |
102.10 - 136.00 |
0.3468 times |
Fri 28 March 2025 |
104.70 (-3.68%) |
112.55 |
95.60 - 120.95 |
0.7356 times |
Fri 28 February 2025 |
108.70 (-15.67%) |
125.20 |
104.00 - 148.95 |
0.5126 times |
DMA SMA EMA moving averages of Southwest 543986
DMA (daily moving average) of Southwest 543986
| DMA period | DMA value | | 5 day DMA | 208.36 | | 12 day DMA | 200.2 | | 20 day DMA | 195.22 | | 35 day DMA | 174.01 | | 50 day DMA | 161.17 | | 100 day DMA | 151.6 | | 150 day DMA | 147.97 | | 200 day DMA | 139.89 | EMA (exponential moving average) of Southwest 543986
| EMA period | EMA current | EMA prev | EMA prev2 | | 5 day EMA | 203.56 | 203.41 | 208.04 | | 12 day EMA | 199.97 | 199.27 | 200.2 | | 20 day EMA | 192.75 | 191.58 | 191.31 | | 35 day EMA | 179.01 | 177.55 | 176.57 | | 50 day EMA | 164.02 | 162.4 | 161.1 |
SMA (simple moving average) of Southwest 543986
| SMA period | SMA current | SMA prev | SMA prev2 | | 5 day SMA | 208.36 | 209.96 | 210.09 | | 12 day SMA | 200.2 | 200.08 | 200.08 | | 20 day SMA | 195.22 | 193.89 | 193.18 | | 35 day SMA | 174.01 | 171.88 | 169.99 | | 50 day SMA | 161.17 | 159.94 | 158.85 | | 100 day SMA | 151.6 | 150.99 | 150.49 | | 150 day SMA | 147.97 | 147.45 | 146.93 | | 200 day SMA | 139.89 | 139.51 | 139.19 |
|
|
