Bondada 543971 full analysis,charts,indicators,moving averages,SMA,DMA,EMA,ADX,MACD,RSIBondada 543971 WideScreen charts, DMA,SMA,EMA technical analysis, forecast prediction, by indicators ADX,MACD,RSI,CCI BSE stock exchange
Daily price and charts and targets Bondada Strong Daily Stock price targets for Bondada 543971 are 412.4 and 425.4 | Daily Target 1 | 409.6 | | Daily Target 2 | 415.2 | | Daily Target 3 | 422.6 | | Daily Target 4 | 428.2 | | Daily Target 5 | 435.6 |
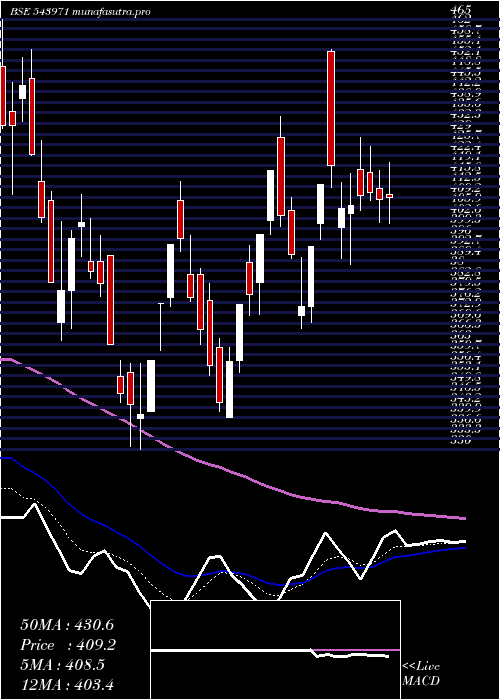
Daily price and volume Bondada
| Date |
Closing |
Open |
Range |
Volume |
Tue 21 October 2025 |
420.80 (-0.61%) |
427.00 |
417.00 - 430.00 |
0.5058 times |
Mon 20 October 2025 |
423.40 (0.73%) |
425.95 |
418.25 - 431.00 |
0.7235 times |
Fri 17 October 2025 |
420.35 (0.83%) |
411.15 |
411.15 - 426.00 |
0.9265 times |
Thu 16 October 2025 |
416.90 (0.69%) |
418.40 |
409.00 - 422.00 |
0.7824 times |
Wed 15 October 2025 |
414.05 (-1.12%) |
418.00 |
412.10 - 422.00 |
0.5279 times |
Tue 14 October 2025 |
418.75 (1.76%) |
409.80 |
405.00 - 422.75 |
1.0117 times |
Mon 13 October 2025 |
411.50 (-1.33%) |
412.60 |
407.15 - 427.30 |
1.7972 times |
Fri 10 October 2025 |
417.05 (5.9%) |
396.00 |
386.10 - 425.00 |
2.5229 times |
Thu 09 October 2025 |
393.80 (-0.91%) |
403.40 |
392.60 - 406.40 |
0.5679 times |
Wed 08 October 2025 |
397.40 (-0.05%) |
395.10 |
395.00 - 406.90 |
0.6341 times |
Tue 07 October 2025 |
397.60 (2.49%) |
388.20 |
387.00 - 402.95 |
1.2451 times |
Weekly price and charts Bondada Strong weekly Stock price targets for Bondada 543971 are 411.9 and 425.9 | Weekly Target 1 | 408.93 | | Weekly Target 2 | 414.87 | | Weekly Target 3 | 422.93333333333 | | Weekly Target 4 | 428.87 | | Weekly Target 5 | 436.93 |
Weekly price and volumes for Bondada
| Date |
Closing |
Open |
Range |
Volume |
Tue 21 October 2025 |
420.80 (0.11%) |
425.95 |
417.00 - 431.00 |
0.3843 times |
Fri 17 October 2025 |
420.35 (0.79%) |
412.60 |
405.00 - 427.30 |
1.5775 times |
Fri 10 October 2025 |
417.05 (8.54%) |
388.00 |
382.00 - 425.00 |
1.7862 times |
Fri 03 October 2025 |
384.25 (1.53%) |
380.00 |
375.00 - 389.95 |
0.5803 times |
Fri 26 September 2025 |
378.45 (-2.17%) |
386.85 |
370.00 - 414.00 |
1.6409 times |
Fri 19 September 2025 |
386.85 (-0.77%) |
392.05 |
383.95 - 401.95 |
1.2148 times |
Fri 12 September 2025 |
389.85 (0.22%) |
391.10 |
382.50 - 408.00 |
0.9475 times |
Fri 05 September 2025 |
389.00 (-1.32%) |
396.00 |
384.00 - 413.75 |
0.5625 times |
Fri 29 August 2025 |
394.20 (-5.9%) |
418.95 |
382.85 - 420.00 |
0.6615 times |
Fri 22 August 2025 |
418.90 (0.4%) |
422.00 |
415.50 - 425.50 |
0.6444 times |
Thu 14 August 2025 |
417.25 (-2.63%) |
428.00 |
416.00 - 428.00 |
0.455 times |

Monthly price and charts Bondada Strong monthly Stock price targets for Bondada 543971 are 397.9 and 453.9 | Monthly Target 1 | 352.93 | | Monthly Target 2 | 386.87 | | Monthly Target 3 | 408.93333333333 | | Monthly Target 4 | 442.87 | | Monthly Target 5 | 464.93 |
Monthly price and volumes Bondada
| Date |
Closing |
Open |
Range |
Volume |
Tue 21 October 2025 |
420.80 (10.97%) |
383.00 |
375.00 - 431.00 |
0.5456 times |
Tue 30 September 2025 |
379.20 (-3.81%) |
396.00 |
370.00 - 414.00 |
0.6103 times |
Fri 29 August 2025 |
394.20 (-11.52%) |
443.10 |
382.85 - 450.00 |
0.3364 times |
Thu 31 July 2025 |
445.50 (1.33%) |
440.00 |
415.50 - 454.00 |
0.485 times |
Mon 30 June 2025 |
439.65 (-11.64%) |
504.00 |
415.05 - 504.00 |
0.9781 times |
Fri 30 May 2025 |
497.55 (14.01%) |
446.00 |
330.05 - 510.00 |
2.7531 times |
Wed 30 April 2025 |
436.40 (16.39%) |
374.95 |
370.00 - 455.60 |
1.0001 times |
Fri 28 March 2025 |
374.95 (7.88%) |
354.00 |
330.00 - 434.40 |
1.3719 times |
Fri 28 February 2025 |
347.55 (-31.26%) |
486.55 |
344.85 - 503.95 |
0.9436 times |
Fri 31 January 2025 |
505.60 (-16.65%) |
609.50 |
449.35 - 634.75 |
0.9758 times |
Tue 31 December 2024 |
606.60 (11.01%) |
548.90 |
542.00 - 719.50 |
1.2337 times |

DMA SMA EMA moving averages of Bondada 543971
DMA (daily moving average) of Bondada 543971
| DMA period | DMA value | | 5 day DMA | 419.1 | | 12 day DMA | 409.96 | | 20 day DMA | 400.4 | | 35 day DMA | 397.34 | | 50 day DMA | 402.76 | | 100 day DMA | 423.84 | | 150 day DMA | 415.37 | | 200 day DMA | 437.09 | EMA (exponential moving average) of Bondada 543971
| EMA period | EMA current | EMA prev | EMA prev2 | | 5 day EMA | 418.95 | 418.02 | 415.33 | | 12 day EMA | 411.44 | 409.74 | 407.26 | | 20 day EMA | 406.69 | 405.2 | 403.29 | | 35 day EMA | 405.98 | 405.11 | 404.03 | | 50 day EMA | 406.98 | 406.42 | 405.73 |
SMA (simple moving average) of Bondada 543971
| SMA period | SMA current | SMA prev | SMA prev2 | | 5 day SMA | 419.1 | 418.69 | 416.31 | | 12 day SMA | 409.96 | 406.92 | 403.66 | | 20 day SMA | 400.4 | 399.48 | 397.65 | | 35 day SMA | 397.34 | 396.74 | 395.91 | | 50 day SMA | 402.76 | 402.88 | 403 | | 100 day SMA | 423.84 | 424.53 | 425.24 | | 150 day SMA | 415.37 | 414.95 | 414.4 | | 200 day SMA | 437.09 | 438.11 | 439.15 |
|
|
