Khazanchi 543953 full analysis,charts,indicators,moving averages,SMA,DMA,EMA,ADX,MACD,RSIKhazanchi 543953 WideScreen charts, DMA,SMA,EMA technical analysis, forecast prediction, by indicators ADX,MACD,RSI,CCI BSE stock exchange
Daily price and charts and targets Khazanchi Strong Daily Stock price targets for Khazanchi 543953 are 637.45 and 647.4 | Daily Target 1 | 629.67 | | Daily Target 2 | 635.28 | | Daily Target 3 | 639.61666666667 | | Daily Target 4 | 645.23 | | Daily Target 5 | 649.57 |
Daily price and volume Khazanchi
| Date |
Closing |
Open |
Range |
Volume |
Tue 21 October 2025 |
640.90 (1.09%) |
634.00 |
634.00 - 643.95 |
0.7202 times |
Mon 20 October 2025 |
634.00 (1.26%) |
625.90 |
625.00 - 634.95 |
0.7036 times |
Fri 17 October 2025 |
626.10 (0.19%) |
624.55 |
610.00 - 628.25 |
1.8709 times |
Thu 16 October 2025 |
624.90 (0.32%) |
622.00 |
621.20 - 625.00 |
0.5215 times |
Wed 15 October 2025 |
622.90 (0.6%) |
619.30 |
617.05 - 623.95 |
1.3659 times |
Tue 14 October 2025 |
619.20 (0.78%) |
613.00 |
613.00 - 619.50 |
0.8278 times |
Mon 13 October 2025 |
614.40 (0.85%) |
608.00 |
608.00 - 614.50 |
0.9354 times |
Fri 10 October 2025 |
609.20 (0.88%) |
604.50 |
603.80 - 609.90 |
0.8195 times |
Thu 09 October 2025 |
603.90 (1.21%) |
599.80 |
596.90 - 604.80 |
1.3328 times |
Wed 08 October 2025 |
596.70 (-0.03%) |
596.90 |
596.00 - 600.00 |
0.9023 times |
Tue 07 October 2025 |
596.90 (0.03%) |
596.50 |
593.00 - 598.90 |
0.7781 times |
Weekly price and charts Khazanchi Strong weekly Stock price targets for Khazanchi 543953 are 632.95 and 651.9 | Weekly Target 1 | 617.67 | | Weekly Target 2 | 629.28 | | Weekly Target 3 | 636.61666666667 | | Weekly Target 4 | 648.23 | | Weekly Target 5 | 655.57 |
Weekly price and volumes for Khazanchi
| Date |
Closing |
Open |
Range |
Volume |
Tue 21 October 2025 |
640.90 (2.36%) |
625.90 |
625.00 - 643.95 |
0.3267 times |
Fri 17 October 2025 |
626.10 (2.77%) |
608.00 |
608.00 - 628.25 |
1.2671 times |
Fri 10 October 2025 |
609.20 (3.09%) |
593.70 |
588.50 - 609.90 |
1.6812 times |
Fri 03 October 2025 |
590.95 (-1.05%) |
597.50 |
586.00 - 601.00 |
0.9062 times |
Fri 26 September 2025 |
597.25 (1.89%) |
593.80 |
577.00 - 670.00 |
1.4875 times |
Fri 19 September 2025 |
586.20 (-1.05%) |
594.95 |
582.50 - 595.00 |
0.6535 times |
Fri 12 September 2025 |
592.40 (-0.1%) |
596.00 |
587.00 - 597.50 |
0.8226 times |
Fri 05 September 2025 |
593.00 (-0.26%) |
603.80 |
589.00 - 603.80 |
0.9802 times |
Fri 29 August 2025 |
594.55 (-0.37%) |
596.75 |
585.50 - 599.95 |
0.9669 times |
Fri 22 August 2025 |
596.75 (-0.83%) |
601.00 |
593.00 - 605.00 |
0.9081 times |
Thu 14 August 2025 |
601.75 (1.45%) |
601.95 |
593.95 - 602.85 |
0.7713 times |
Monthly price and charts Khazanchi Strong monthly Stock price targets for Khazanchi 543953 are 614.45 and 670.4 | Monthly Target 1 | 568.33 | | Monthly Target 2 | 604.62 | | Monthly Target 3 | 624.28333333333 | | Monthly Target 4 | 660.57 | | Monthly Target 5 | 680.23 |
Monthly price and volumes Khazanchi
| Date |
Closing |
Open |
Range |
Volume |
Tue 21 October 2025 |
640.90 (8.77%) |
593.25 |
588.00 - 643.95 |
0.8536 times |
Tue 30 September 2025 |
589.25 (-0.89%) |
603.80 |
577.00 - 670.00 |
1.038 times |
Fri 29 August 2025 |
594.55 (-1.11%) |
601.25 |
585.50 - 608.80 |
0.9637 times |
Thu 31 July 2025 |
601.25 (4.82%) |
570.00 |
562.00 - 608.80 |
1.3538 times |
Mon 30 June 2025 |
573.60 (2.05%) |
565.00 |
539.95 - 575.00 |
0.9036 times |
Fri 30 May 2025 |
562.10 (2.13%) |
565.00 |
534.95 - 619.00 |
1.5626 times |
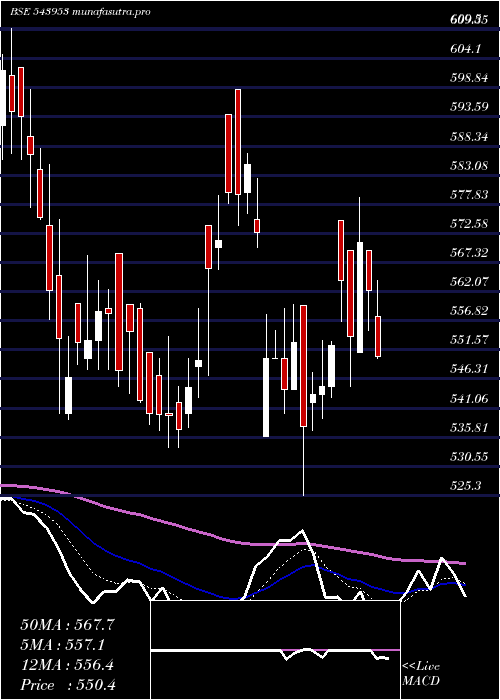
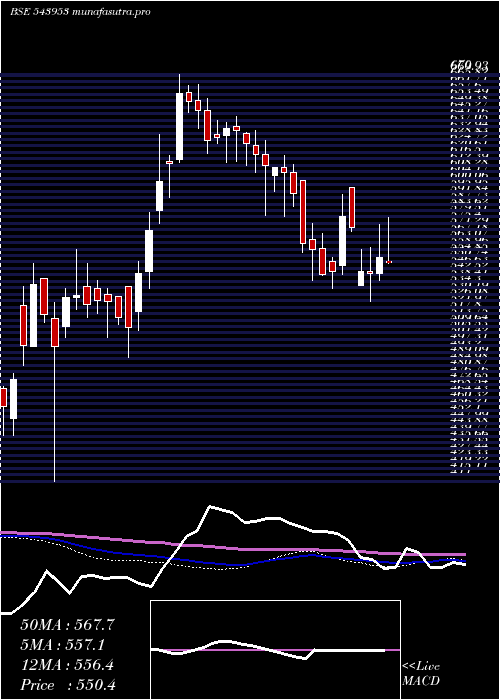
Wed 30 April 2025 |
550.40 (-5.1%) |
598.50 |
525.30 - 598.50 |
0.3879 times |
Fri 28 March 2025 |
580.00 (3.15%) |
565.00 |
534.00 - 594.00 |
1.3817 times |
Fri 28 February 2025 |
562.30 (-8.16%) |
606.00 |
557.00 - 618.50 |
0.4808 times |
Fri 31 January 2025 |
612.25 (-1.96%) |
626.00 |
580.10 - 643.50 |
1.0743 times |
Tue 31 December 2024 |
624.50 (-5.08%) |
659.00 |
614.00 - 664.00 |
0.7651 times |

DMA SMA EMA moving averages of Khazanchi 543953
DMA (daily moving average) of Khazanchi 543953
| DMA period | DMA value | | 5 day DMA | 629.76 | | 12 day DMA | 615.49 | | 20 day DMA | 607.29 | | 35 day DMA | 600.18 | | 50 day DMA | 598.93 | | 100 day DMA | 589.09 | | 150 day DMA | 579.43 | | 200 day DMA | 586.8 | EMA (exponential moving average) of Khazanchi 543953
| EMA period | EMA current | EMA prev | EMA prev2 | | 5 day EMA | 630.4 | 625.15 | 620.72 | | 12 day EMA | 619.12 | 615.16 | 611.74 | | 20 day EMA | 612.06 | 609.03 | 606.4 | | 35 day EMA | 606.33 | 604.3 | 602.55 | | 50 day EMA | 602.32 | 600.75 | 599.39 |
SMA (simple moving average) of Khazanchi 543953
| SMA period | SMA current | SMA prev | SMA prev2 | | 5 day SMA | 629.76 | 625.42 | 621.5 | | 12 day SMA | 615.49 | 611.33 | 607.66 | | 20 day SMA | 607.29 | 604.73 | 602.34 | | 35 day SMA | 600.18 | 599.01 | 597.88 | | 50 day SMA | 598.93 | 598.04 | 597.4 | | 100 day SMA | 589.09 | 588.35 | 587.81 | | 150 day SMA | 579.43 | 578.84 | 578.26 | | 200 day SMA | 586.8 | 586.74 | 586.71 |
|
|
