Macind 543934 full analysis,charts,indicators,moving averages,SMA,DMA,EMA,ADX,MACD,RSIMacind 543934 WideScreen charts, DMA,SMA,EMA technical analysis, forecast prediction, by indicators ADX,MACD,RSI,CCI BSE stock exchange
Daily price and charts and targets Macind Strong Daily Stock price targets for Macind 543934 are 373.15 and 373.15 | Daily Target 1 | 373.15 | | Daily Target 2 | 373.15 | | Daily Target 3 | 373.15 | | Daily Target 4 | 373.15 | | Daily Target 5 | 373.15 |
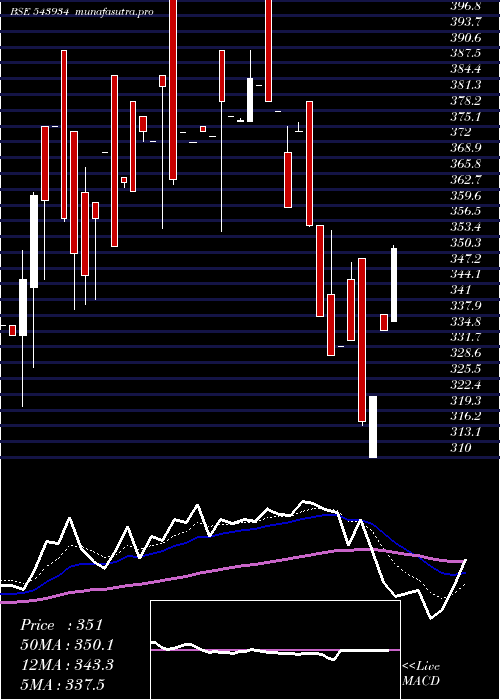
Daily price and volume Macind
| Date |
Closing |
Open |
Range |
Volume |
Tue 21 October 2025 |
373.15 (-0.49%) |
373.15 |
373.15 - 373.15 |
0.0122 times |
Mon 20 October 2025 |
375.00 (4.17%) |
351.00 |
351.00 - 379.00 |
0.3293 times |
Fri 17 October 2025 |
360.00 (-2.44%) |
380.00 |
360.00 - 380.00 |
0.2073 times |
Thu 16 October 2025 |
369.00 (-0.27%) |
370.00 |
335.00 - 382.00 |
0.6585 times |
Wed 15 October 2025 |
370.00 (1.93%) |
385.00 |
327.00 - 385.00 |
1.061 times |
Tue 14 October 2025 |
363.00 (6.76%) |
370.00 |
359.80 - 370.00 |
3.2195 times |
Mon 13 October 2025 |
340.00 (6.25%) |
350.00 |
340.00 - 350.00 |
0.5854 times |
Fri 10 October 2025 |
320.00 (-0.31%) |
350.00 |
320.00 - 350.00 |
1.9024 times |
Thu 09 October 2025 |
321.00 (9.18%) |
305.00 |
305.00 - 323.40 |
1.8293 times |
Wed 08 October 2025 |
294.00 (0%) |
294.00 |
294.00 - 294.00 |
0.1951 times |
Tue 07 October 2025 |
294.00 (4.64%) |
294.95 |
280.95 - 294.95 |
1.2439 times |
Weekly price and charts Macind Strong weekly Stock price targets for Macind 543934 are 362.08 and 390.08 | Weekly Target 1 | 339.72 | | Weekly Target 2 | 356.43 | | Weekly Target 3 | 367.71666666667 | | Weekly Target 4 | 384.43 | | Weekly Target 5 | 395.72 |
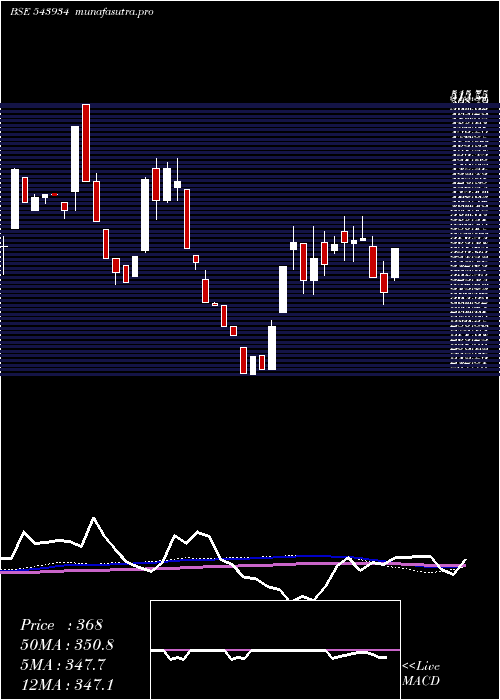
Weekly price and volumes for Macind
| Date |
Closing |
Open |
Range |
Volume |
Tue 21 October 2025 |
373.15 (3.65%) |
351.00 |
351.00 - 379.00 |
0.085 times |
Fri 17 October 2025 |
360.00 (12.5%) |
350.00 |
327.00 - 385.00 |
1.426 times |
Fri 10 October 2025 |
320.00 (19.58%) |
280.95 |
280.95 - 350.00 |
1.341 times |
Fri 03 October 2025 |
267.60 (2.37%) |
253.60 |
247.10 - 267.60 |
0.6978 times |
Fri 26 September 2025 |
261.40 (2.11%) |
243.25 |
243.25 - 288.90 |
1.335 times |
Wed 17 September 2025 |
256.00 (-7.11%) |
261.85 |
256.00 - 274.90 |
1.4684 times |
Fri 12 September 2025 |
275.60 (-2.48%) |
282.60 |
275.55 - 309.00 |
2.7549 times |
Fri 05 September 2025 |
282.60 (-9.86%) |
298.55 |
280.25 - 304.50 |
0.2579 times |
Tue 26 August 2025 |
313.50 (-6.7%) |
330.00 |
313.50 - 330.00 |
0.0971 times |
Fri 22 August 2025 |
336.00 (-0.55%) |
337.85 |
336.00 - 337.85 |
0.537 times |
Thu 14 August 2025 |
337.85 (-1.99%) |
337.85 |
337.85 - 337.85 |
0.0364 times |
Monthly price and charts Macind Strong monthly Stock price targets for Macind 543934 are 313.4 and 444.75 | Monthly Target 1 | 205.92 | | Monthly Target 2 | 289.53 | | Monthly Target 3 | 337.26666666667 | | Monthly Target 4 | 420.88 | | Monthly Target 5 | 468.62 |
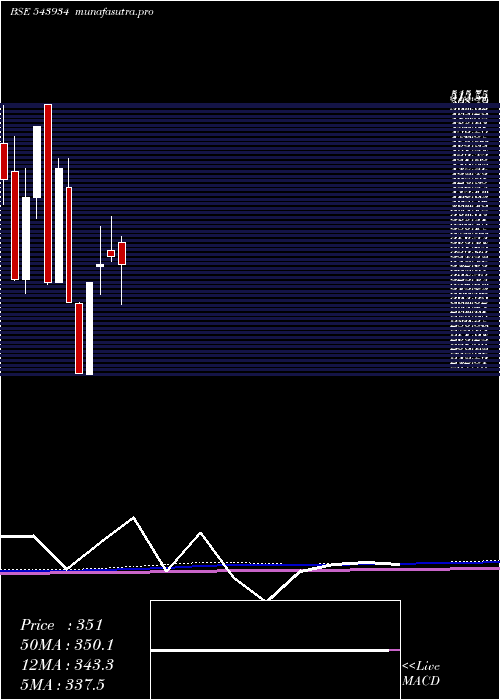
Monthly price and volumes Macind
| Date |
Closing |
Open |
Range |
Volume |
Tue 21 October 2025 |
373.15 (51.01%) |
254.90 |
253.65 - 385.00 |
0.9202 times |
Tue 30 September 2025 |
247.10 (-21.18%) |
298.55 |
243.25 - 309.00 |
1.7521 times |
Tue 26 August 2025 |
313.50 (-19.4%) |
381.20 |
313.50 - 381.20 |
0.2727 times |
Tue 22 July 2025 |
388.95 (8.31%) |
374.00 |
310.00 - 402.00 |
2.41 times |
Mon 30 June 2025 |
359.10 (2.16%) |
365.00 |
354.35 - 400.00 |
0.5047 times |
Fri 30 May 2025 |
351.50 (5.78%) |
348.85 |
320.00 - 390.00 |
1.8205 times |
Wed 30 April 2025 |
332.30 (39.42%) |
237.75 |
237.75 - 332.30 |
0.438 times |
Wed 26 March 2025 |
238.35 (-23.58%) |
311.00 |
238.35 - 311.90 |
0.3636 times |
Fri 28 February 2025 |
311.90 (-30.69%) |
430.00 |
311.90 - 460.00 |
0.2623 times |
Fri 31 January 2025 |
450.00 (35.3%) |
332.60 |
332.60 - 460.50 |
1.2561 times |
Tue 31 December 2024 |
332.60 (-32.61%) |
515.75 |
330.00 - 515.75 |
1.2396 times |
DMA SMA EMA moving averages of Macind 543934
DMA (daily moving average) of Macind 543934
| DMA period | DMA value | | 5 day DMA | 369.43 | | 12 day DMA | 338.34 | | 20 day DMA | 306.9 | | 35 day DMA | 296.34 | | 50 day DMA | 313.59 | | 100 day DMA | 336.57 | | 150 day DMA | 336.43 | | 200 day DMA | 352.25 | EMA (exponential moving average) of Macind 543934
| EMA period | EMA current | EMA prev | EMA prev2 | | 5 day EMA | 365.5 | 361.67 | 355 | | 12 day EMA | 342.17 | 336.54 | 329.55 | | 20 day EMA | 326.36 | 321.44 | 315.81 | | 35 day EMA | 322.53 | 319.55 | 316.29 | | 50 day EMA | 323.44 | 321.41 | 319.22 |
SMA (simple moving average) of Macind 543934
| SMA period | SMA current | SMA prev | SMA prev2 | | 5 day SMA | 369.43 | 367.4 | 360.4 | | 12 day SMA | 338.34 | 329.55 | 319.54 | | 20 day SMA | 306.9 | 300.49 | 294.54 | | 35 day SMA | 296.34 | 295.11 | 293.99 | | 50 day SMA | 313.59 | 313.93 | 314.14 | | 100 day SMA | 336.57 | 336.16 | 335.57 | | 150 day SMA | 336.43 | 336.72 | 337.14 | | 200 day SMA | 352.25 | 352.42 | 352.62 |
|
|
