Cyientdlm 543933 full analysis,charts,indicators,moving averages,SMA,DMA,EMA,ADX,MACD,RSICyientdlm 543933 WideScreen charts, DMA,SMA,EMA technical analysis, forecast prediction, by indicators ADX,MACD,RSI,CCI BSE stock exchange
Daily price and charts and targets Cyientdlm Strong Daily Stock price targets for Cyientdlm 543933 are 462.4 and 468.35 | Daily Target 1 | 457.92 | | Daily Target 2 | 460.93 | | Daily Target 3 | 463.86666666667 | | Daily Target 4 | 466.88 | | Daily Target 5 | 469.82 |
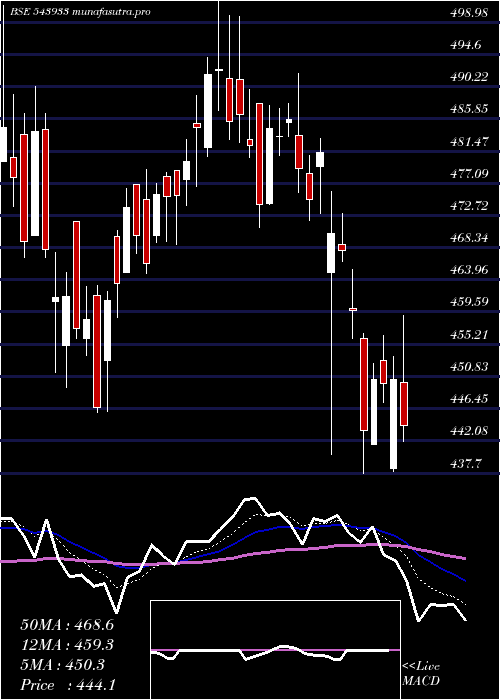
Daily price and volume Cyientdlm
| Date |
Closing |
Open |
Range |
Volume |
Tue 21 October 2025 |
463.95 (0.26%) |
463.05 |
460.85 - 466.80 |
0.1749 times |
Mon 20 October 2025 |
462.75 (4.26%) |
443.05 |
443.05 - 467.00 |
0.6262 times |
Fri 17 October 2025 |
443.85 (0.53%) |
444.35 |
438.95 - 447.70 |
0.4495 times |
Thu 16 October 2025 |
441.50 (-0.14%) |
442.10 |
438.05 - 448.20 |
3.6876 times |
Wed 15 October 2025 |
442.10 (-5.41%) |
473.75 |
435.00 - 481.55 |
2.1399 times |
Tue 14 October 2025 |
467.40 (-4.01%) |
489.20 |
463.30 - 495.50 |
1.0136 times |
Mon 13 October 2025 |
486.95 (3.25%) |
471.00 |
460.50 - 493.40 |
0.4882 times |
Fri 10 October 2025 |
471.60 (3.22%) |
458.60 |
454.10 - 477.00 |
0.4652 times |
Thu 09 October 2025 |
456.90 (1.06%) |
452.20 |
444.90 - 460.05 |
0.719 times |
Wed 08 October 2025 |
452.10 (0.96%) |
447.95 |
443.25 - 454.70 |
0.236 times |
Tue 07 October 2025 |
447.80 (4.36%) |
430.15 |
430.15 - 467.55 |
4.5678 times |
Weekly price and charts Cyientdlm Strong weekly Stock price targets for Cyientdlm 543933 are 453.5 and 477.45 | Weekly Target 1 | 434.05 | | Weekly Target 2 | 449 | | Weekly Target 3 | 458 | | Weekly Target 4 | 472.95 | | Weekly Target 5 | 481.95 |
Weekly price and volumes for Cyientdlm
| Date |
Closing |
Open |
Range |
Volume |
Tue 21 October 2025 |
463.95 (4.53%) |
443.05 |
443.05 - 467.00 |
0.3025 times |
Fri 17 October 2025 |
443.85 (-5.88%) |
471.00 |
435.00 - 495.50 |
2.9377 times |
Fri 10 October 2025 |
471.60 (8.05%) |
430.50 |
426.75 - 477.00 |
2.2989 times |
Fri 03 October 2025 |
436.45 (0.61%) |
430.05 |
413.30 - 438.25 |
0.475 times |
Fri 26 September 2025 |
433.80 (-9.5%) |
479.20 |
431.55 - 484.85 |
0.8213 times |
Fri 19 September 2025 |
479.35 (5.29%) |
458.20 |
458.10 - 484.90 |
0.8486 times |
Fri 12 September 2025 |
455.25 (5.07%) |
435.95 |
435.65 - 481.00 |
1.2801 times |
Fri 05 September 2025 |
433.30 (2.62%) |
423.00 |
421.75 - 446.20 |
0.4958 times |
Fri 29 August 2025 |
422.25 (-5.11%) |
449.20 |
416.05 - 453.70 |
0.3185 times |
Fri 22 August 2025 |
445.00 (6.14%) |
423.00 |
422.60 - 448.70 |
0.2215 times |
Thu 14 August 2025 |
419.25 (-1.65%) |
422.20 |
415.00 - 433.55 |
0.46 times |

Monthly price and charts Cyientdlm Strong monthly Stock price targets for Cyientdlm 543933 are 441.98 and 517.48 | Monthly Target 1 | 384.32 | | Monthly Target 2 | 424.13 | | Monthly Target 3 | 459.81666666667 | | Monthly Target 4 | 499.63 | | Monthly Target 5 | 535.32 |
Monthly price and volumes Cyientdlm
| Date |
Closing |
Open |
Range |
Volume |
Tue 21 October 2025 |
463.95 (10.18%) |
420.00 |
420.00 - 495.50 |
1.1112 times |
Tue 30 September 2025 |
421.10 (-0.27%) |
423.00 |
413.30 - 484.90 |
0.7123 times |
Fri 29 August 2025 |
422.25 (-6.26%) |
450.00 |
415.00 - 459.20 |
0.3245 times |
Thu 31 July 2025 |
450.45 (-5.27%) |
478.00 |
437.70 - 505.00 |
1.159 times |
Mon 30 June 2025 |
475.50 (-1.76%) |
483.15 |
446.00 - 501.30 |
0.7527 times |
Fri 30 May 2025 |
484.00 (8.16%) |
448.10 |
412.75 - 496.75 |
1.0204 times |
Wed 30 April 2025 |
447.50 (-2.11%) |
461.90 |
417.75 - 499.00 |
1.0164 times |
Fri 28 March 2025 |
457.15 (13.59%) |
405.00 |
380.50 - 483.55 |
1.2623 times |
Fri 28 February 2025 |
402.45 (-17.62%) |
503.25 |
391.40 - 503.25 |
1.0244 times |
Fri 31 January 2025 |
488.50 (-27%) |
670.00 |
454.00 - 680.35 |
1.6167 times |
Tue 31 December 2024 |
669.20 (-4.23%) |
697.05 |
647.00 - 743.15 |
1.0266 times |

DMA SMA EMA moving averages of Cyientdlm 543933
DMA (daily moving average) of Cyientdlm 543933
| DMA period | DMA value | | 5 day DMA | 450.83 | | 12 day DMA | 455.5 | | 20 day DMA | 448.64 | | 35 day DMA | 453.05 | | 50 day DMA | 446.22 | | 100 day DMA | 457.81 | | 150 day DMA | 453.55 | | 200 day DMA | 471.08 | EMA (exponential moving average) of Cyientdlm 543933
| EMA period | EMA current | EMA prev | EMA prev2 | | 5 day EMA | 457.37 | 454.08 | 449.74 | | 12 day EMA | 454.79 | 453.12 | 451.37 | | 20 day EMA | 453.13 | 451.99 | 450.86 | | 35 day EMA | 448.48 | 447.57 | 446.68 | | 50 day EMA | 445.96 | 445.23 | 444.51 |
SMA (simple moving average) of Cyientdlm 543933
| SMA period | SMA current | SMA prev | SMA prev2 | | 5 day SMA | 450.83 | 451.52 | 456.36 | | 12 day SMA | 455.5 | 453.21 | 450.56 | | 20 day SMA | 448.64 | 449.35 | 450.18 | | 35 day SMA | 453.05 | 451.95 | 450.8 | | 50 day SMA | 446.22 | 445.6 | 445.01 | | 100 day SMA | 457.81 | 457.99 | 458.22 | | 150 day SMA | 453.55 | 453.18 | 452.77 | | 200 day SMA | 471.08 | 472.09 | 473.16 |
|
|
