Avalon 543896 full analysis,charts,indicators,moving averages,SMA,DMA,EMA,ADX,MACD,RSIAvalon 543896 WideScreen charts, DMA,SMA,EMA technical analysis, forecast prediction, by indicators ADX,MACD,RSI,CCI BSE stock exchange
Daily price and charts and targets Avalon Strong Daily Stock price targets for Avalon 543896 are 1193.28 and 1223.53 | Daily Target 1 | 1186.77 | | Daily Target 2 | 1199.78 | | Daily Target 3 | 1217.0166666667 | | Daily Target 4 | 1230.03 | | Daily Target 5 | 1247.27 |
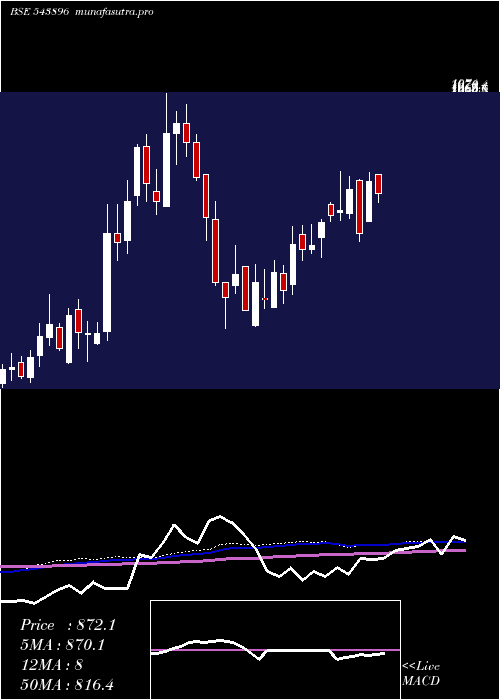
Daily price and volume Avalon
| Date |
Closing |
Open |
Range |
Volume |
Tue 21 October 2025 |
1212.80 (0.33%) |
1218.05 |
1204.00 - 1234.25 |
0.1021 times |
Mon 20 October 2025 |
1208.85 (2.78%) |
1185.35 |
1172.10 - 1230.00 |
1.0579 times |
Fri 17 October 2025 |
1176.10 (2.12%) |
1149.95 |
1145.75 - 1197.60 |
0.8954 times |
Thu 16 October 2025 |
1151.70 (0.63%) |
1145.15 |
1141.75 - 1175.00 |
0.5393 times |
Wed 15 October 2025 |
1144.50 (-0.49%) |
1146.05 |
1135.90 - 1168.05 |
0.5838 times |
Tue 14 October 2025 |
1150.15 (-5.59%) |
1218.90 |
1141.65 - 1235.60 |
0.8927 times |
Mon 13 October 2025 |
1218.30 (-0.69%) |
1224.75 |
1214.30 - 1260.25 |
0.4202 times |
Fri 10 October 2025 |
1226.80 (-0.68%) |
1229.00 |
1221.70 - 1269.00 |
1.1073 times |
Thu 09 October 2025 |
1235.20 (0.62%) |
1221.00 |
1215.65 - 1250.80 |
0.6371 times |
Wed 08 October 2025 |
1227.55 (-2.07%) |
1250.50 |
1205.50 - 1250.50 |
3.7643 times |
Tue 07 October 2025 |
1253.55 (10.8%) |
1131.95 |
1131.40 - 1316.20 |
14.8869 times |

Weekly price and charts Avalon Strong weekly Stock price targets for Avalon 543896 are 1192.45 and 1254.6 | Weekly Target 1 | 1144.23 | | Weekly Target 2 | 1178.52 | | Weekly Target 3 | 1206.3833333333 | | Weekly Target 4 | 1240.67 | | Weekly Target 5 | 1268.53 |
Weekly price and volumes for Avalon
| Date |
Closing |
Open |
Range |
Volume |
Tue 21 October 2025 |
1212.80 (3.12%) |
1185.35 |
1172.10 - 1234.25 |
0.1426 times |
Fri 17 October 2025 |
1176.10 (-4.13%) |
1224.75 |
1135.90 - 1260.25 |
0.4097 times |
Fri 10 October 2025 |
1226.80 (16.27%) |
1042.05 |
1038.25 - 1316.20 |
3.3126 times |
Fri 03 October 2025 |
1055.15 (6.24%) |
1019.85 |
971.65 - 1060.00 |
0.3329 times |
Fri 26 September 2025 |
993.20 (2.19%) |
968.00 |
954.00 - 1028.35 |
2.4056 times |
Fri 19 September 2025 |
971.95 (0.35%) |
978.80 |
939.50 - 1009.70 |
0.6384 times |
Fri 12 September 2025 |
968.60 (4.9%) |
916.20 |
900.00 - 990.10 |
1.0471 times |
Fri 05 September 2025 |
923.35 (11.01%) |
831.60 |
831.60 - 928.40 |
0.8191 times |
Fri 29 August 2025 |
831.80 (-2.65%) |
870.00 |
826.30 - 882.00 |
0.4857 times |
Fri 22 August 2025 |
854.45 (1.99%) |
838.10 |
838.10 - 874.75 |
0.4064 times |
Thu 14 August 2025 |
837.80 (-6.66%) |
898.70 |
832.55 - 917.60 |
0.5703 times |
Monthly price and charts Avalon Strong monthly Stock price targets for Avalon 543896 are 1107.8 and 1421.2 | Monthly Target 1 | 863.87 | | Monthly Target 2 | 1038.33 | | Monthly Target 3 | 1177.2666666667 | | Monthly Target 4 | 1351.73 | | Monthly Target 5 | 1490.67 |
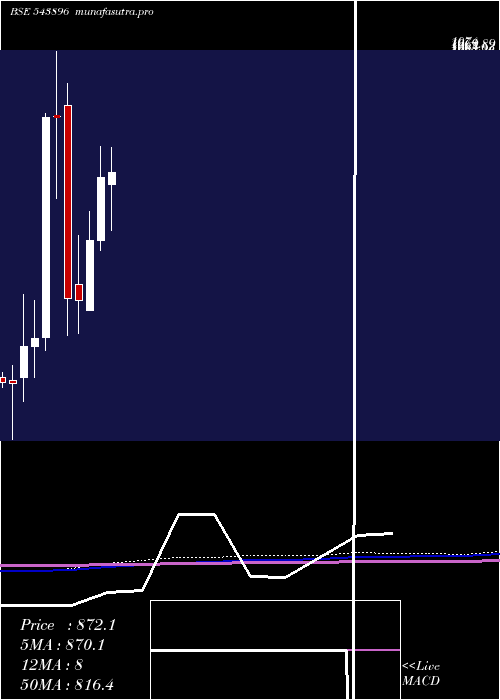
Monthly price and volumes Avalon
| Date |
Closing |
Open |
Range |
Volume |
Tue 21 October 2025 |
1212.80 (20.25%) |
1008.95 |
1002.80 - 1316.20 |
0.9494 times |
Tue 30 September 2025 |
1008.55 (21.25%) |
831.60 |
831.60 - 1028.35 |
1.187 times |
Fri 29 August 2025 |
831.80 (-1.61%) |
832.25 |
826.30 - 964.75 |
1.1018 times |
Thu 31 July 2025 |
845.40 (0.31%) |
836.20 |
788.70 - 891.00 |
0.3184 times |
Mon 30 June 2025 |
842.75 (-1.89%) |
848.45 |
785.50 - 883.95 |
0.4614 times |
Fri 30 May 2025 |
858.95 (-0.52%) |
851.60 |
775.00 - 929.30 |
1.0727 times |
Wed 30 April 2025 |
863.40 (13.85%) |
758.95 |
742.55 - 915.10 |
1.0388 times |
Fri 28 March 2025 |
758.35 (15.15%) |
641.05 |
641.05 - 806.90 |
0.7943 times |
Fri 28 February 2025 |
658.60 (-0.36%) |
685.05 |
602.45 - 767.00 |
1.1476 times |
Fri 31 January 2025 |
661.00 (-31.49%) |
983.95 |
599.25 - 1021.00 |
1.9285 times |
Tue 31 December 2024 |
964.85 (0.05%) |
965.95 |
829.25 - 1074.00 |
1.6509 times |
DMA SMA EMA moving averages of Avalon 543896
DMA (daily moving average) of Avalon 543896
| DMA period | DMA value | | 5 day DMA | 1178.79 | | 12 day DMA | 1194.74 | | 20 day DMA | 1121.01 | | 35 day DMA | 1042.47 | | 50 day DMA | 987.72 | | 100 day DMA | 918.65 | | 150 day DMA | 881.63 | | 200 day DMA | 853.38 | EMA (exponential moving average) of Avalon 543896
| EMA period | EMA current | EMA prev | EMA prev2 | | 5 day EMA | 1192.5 | 1182.35 | 1169.1 | | 12 day EMA | 1165.67 | 1157.1 | 1147.7 | | 20 day EMA | 1127.77 | 1118.82 | 1109.35 | | 35 day EMA | 1065.39 | 1056.71 | 1047.75 | | 50 day EMA | 998.55 | 989.81 | 980.87 |
SMA (simple moving average) of Avalon 543896
| SMA period | SMA current | SMA prev | SMA prev2 | | 5 day SMA | 1178.79 | 1166.26 | 1168.15 | | 12 day SMA | 1194.74 | 1181.6 | 1164.89 | | 20 day SMA | 1121.01 | 1109.26 | 1097.41 | | 35 day SMA | 1042.47 | 1031.87 | 1021.1 | | 50 day SMA | 987.72 | 982.58 | 976 | | 100 day SMA | 918.65 | 915.23 | 911.59 | | 150 day SMA | 881.63 | 878.28 | 874.83 | | 200 day SMA | 853.38 | 852.26 | 851.18 |
|
|
